Weekly New Infections Charts
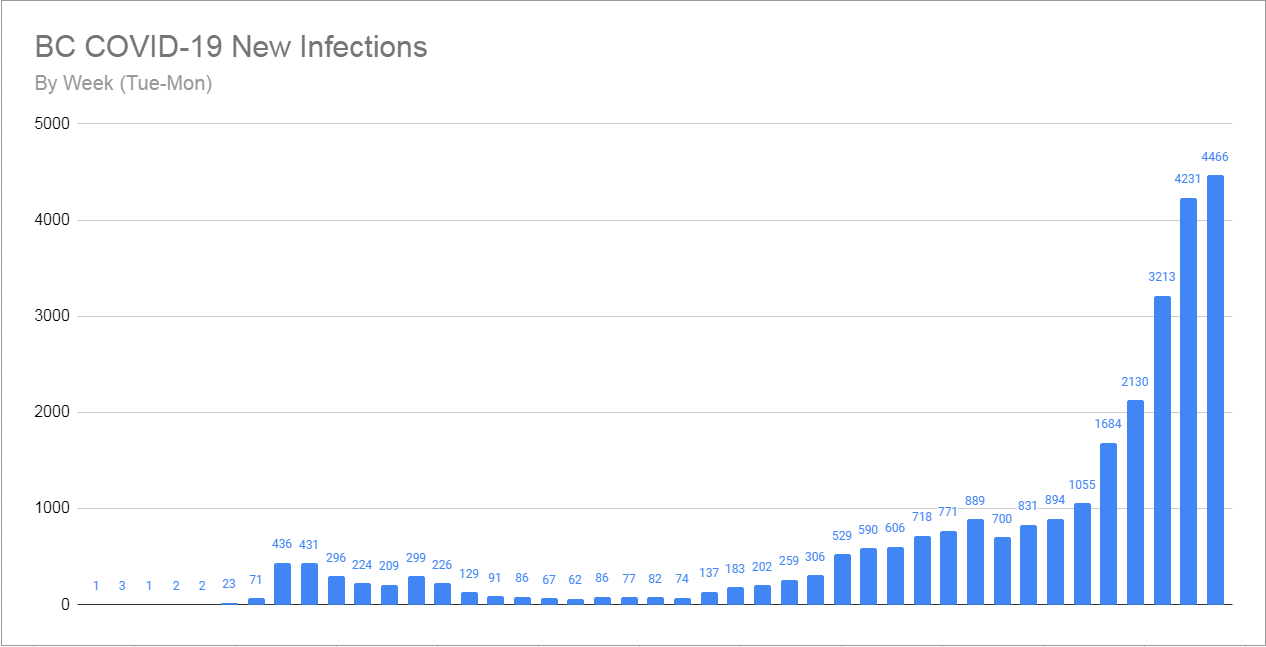
Every Monday we take a look at our week to week totals and chart how BC’s fight against COVID-19 is progressing. Because of the reporting schedule used in BC, we use 7-day totals running from Tuesday to Monday. The above chart shows each week of the pandemic as a unique bar. As you can see above, our numbers are still trending upwards, despite the new restrictions put in place a little over 2 weeks ago.
The news isn’t all bad however, in the last 7-day period the record for the newest cases reported in a single day was broken only 2 times. In the 7-day period previous to that, the record was broken 4 times. The current record for the most number of new cases in a single day currently sits at 762.
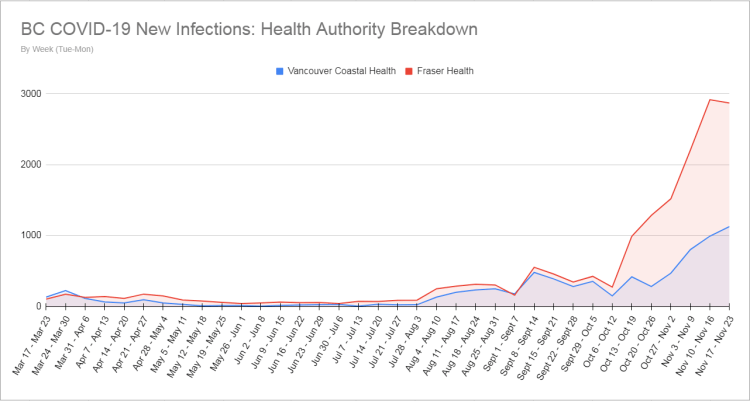
Starting this week we are now adding health authority breakdown charts of the weekly totals. As you can see from the above graphs, Fraser Health continues to report the lion’s share of new cases, but for the first time since early October, the numbers took a small turn downwards.

While the Vancouver Island, Interior, and Northern Health Authorities continue to have far fewer cases than Vancouver Coastal or Fraser, all 3 of them are currently showing significant increases in new daily cases. Perhaps most notable are the current case numbers coming from Vancouver Island, who until recently had been extremely successful in preventing transmission in their area.

Also new for this week is the above chart showing the progression of active COVID-19 cases in the province, compared against the number of new daily cases. As you can see the number of active cases in the province has taken a sharp upwards turn over the last 6-7 weeks. We are now approaching almost 8000 active cases, which is almost 4x the number we were at in mid-October.
Week-to-Week Growth Rate

Here we see some positive news! For the second week in a row, we have seen a decline in the growth rate of new cases in BC. In the previous 7 days, our new case numbers only increased by 5.6%, a massive drop from the growth of 50.8% seen just 2 weeks before that. We can now say that BC has downward momentum, and if this trend continues we could see a negative growth rate in the next week. In another 1.5-2 weeks, we will also be seeing the effects from last Thursday’s further tightening of social restrictions. To truly make a difference we need to push our growth rate firmly into the negative, and together we can make that happen.
Hospitalizations & Deaths
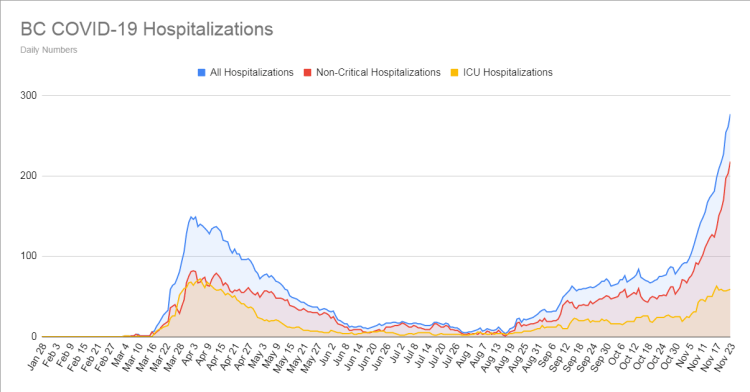
This is another new chart we are debuting this week. Above you can see the level of COVID-19 hospitalizations over the course of the pandemic, broken down into regular hospitalizations, Intensive Care Unit hospitalizations, and the total combined number.
In the last month, our hospitalization numbers have begun to spike into potentially dangerous territory. We also know from Health Minister Adrian Dix’s recent hospital beds report that many health authorities are close to reaching their initial base bed limits. However, there are still surge beds that can be utilized, and also emergency beds in make-shift hospital spaces that can also be called upon.
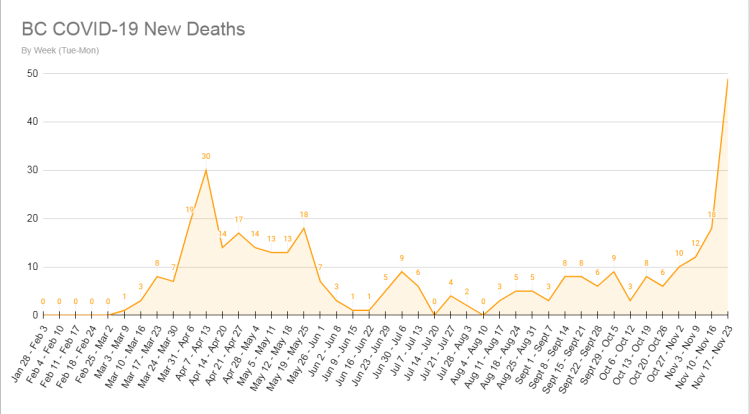
This is the last new chart we are debuting this week, a week-to-week comparison chart of COVID-19 related deaths in the province. For much of the pandemic, our daily death numbers usually stayed in the range of 0-2, but in the last 7-days, we’ve averaged 7 deaths per day. We also set a new record for the most deaths reported in a single day last Tuesday, with 11 deaths. Hopefully, we can bend this curve down quickly to prevent further deaths!
That’s all for now, stay safe everyone!
