
Weekly New Infections Charts
Every Monday we take a look at our week-to-week totals and chart how BC’s fight against COVID-19 is progressing. Because of the reporting schedule used in BC, we use 7-day totals running from Tuesday to Monday. The above chart shows each week of the pandemic as a unique bar.
For the sixth week in a row our new case number 7-day totals have dropped. Last week we saw almost 900 fewer new cases reported compared to the previous week. Our 7-day totals are now lower than they were at the end of our second wave. While we still have a long way to go, it is worth celebrating that we have officially beaten back the increases caused by the third wave!
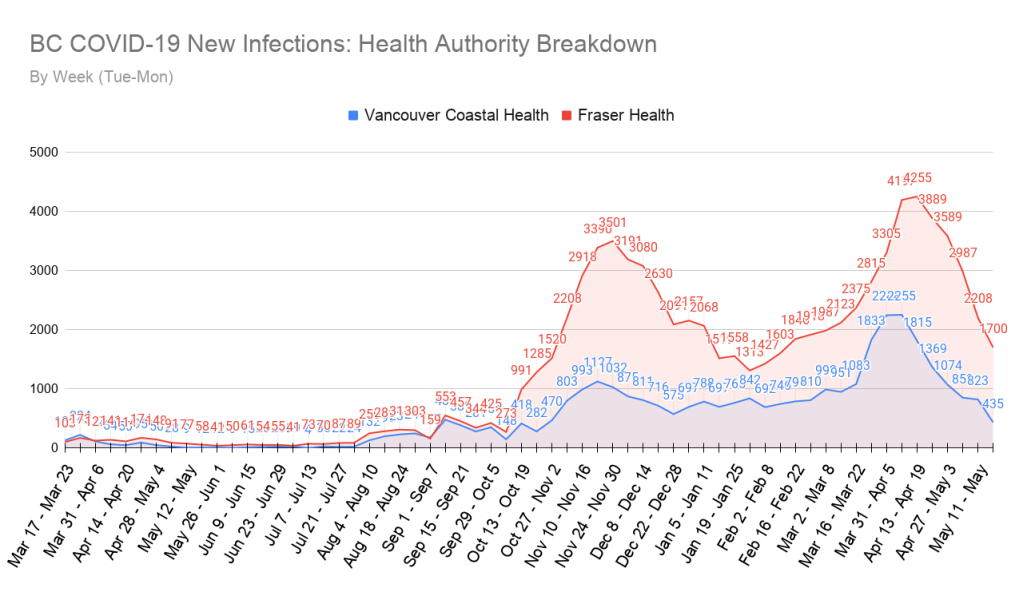
To better understand how the provincial numbers break down, we also look at the individual health authority regions.
We are continuing to see significant improvements from the Fraser Health region! But while the number of new cases there are dropping quickly, this one region still represents about 63% of all new cases in the province. Vancouver Coastal Health has also seen a major drop in new case numbers.
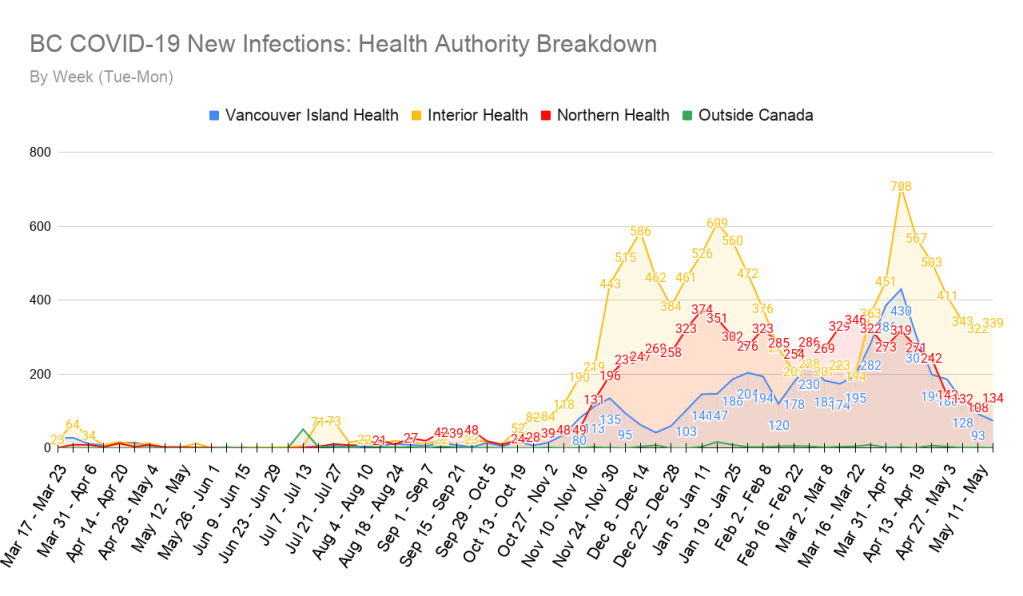
In the above chart you can see that the Vancouver Island health region is continuing to see fewer and fewer new cases each week. In fact, it saw fewer than 100 new cases reported in the past 7 days! Unfortunately, both the Interior and Northern health regions have seen a small increase in new case numbers during that same period. We know that Northern Health has had 2 outbreaks in the last week, but nothing like that has been reported for Interior Health yet. Hopefully this will not become a trend.
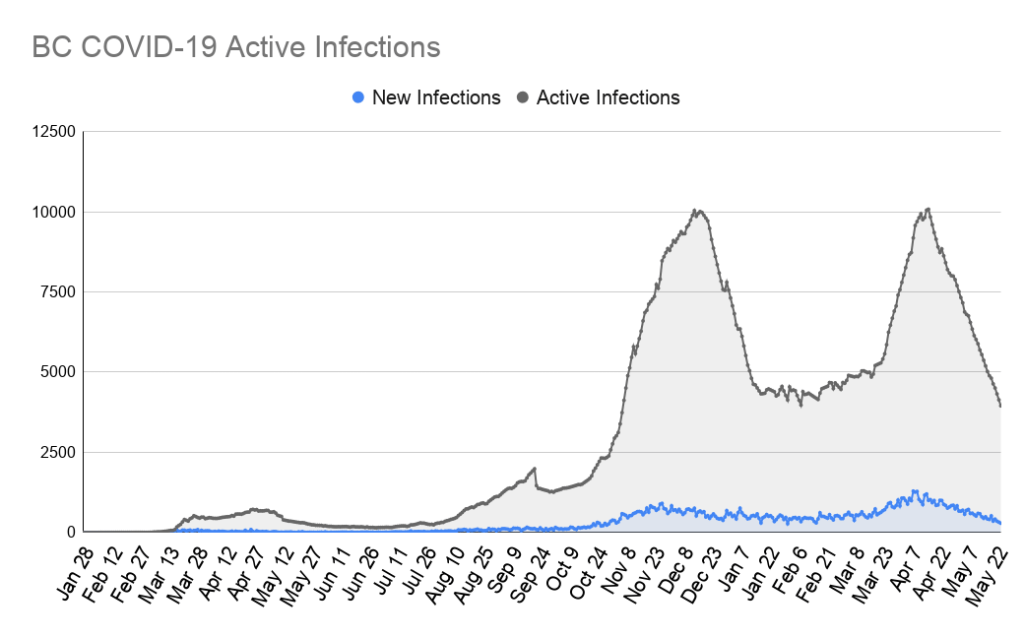
There are currently 3,953 known active cases of COVID-19 in BC. This number represents a decrease of almost 1100 active cases from this time last week. This is yet another substantial decline in active cases! As you can see from the above graph the numbers are dropping almost as quickly as they rose up a few months ago! We would also like to take this time to acknowledge that yes, this graph DOES look like it has cat-ears.
Week-to-Week Growth Rate
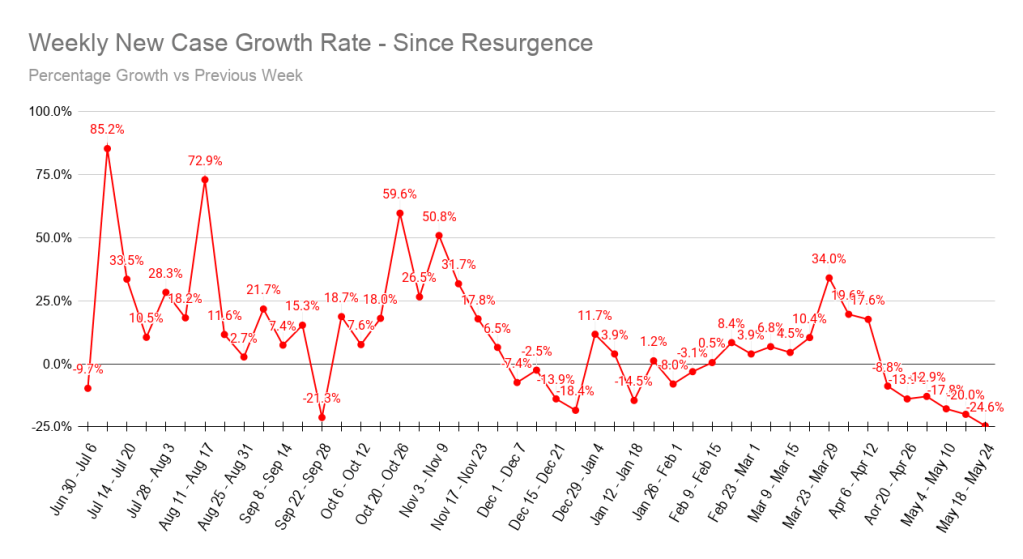
This graph tracks the growth rate between 7-day totals and is a good indicator of the overall momentum of new case numbers.
In the last 7 days BC has seen another decrease in our new case growth rate! Our province saw a new case growth rate of -24.6%! Not only is this the 6th week of sustained negative growth of new cases, but it’s also the lowest growth rate we’ve seen during the pandemic, ever. This is incredibly encouraging to see, and stands as a testament to all the hard work all of us have been putting into following the restrictions and public health guidelines. It’s working!
Hospitalizations & Deaths
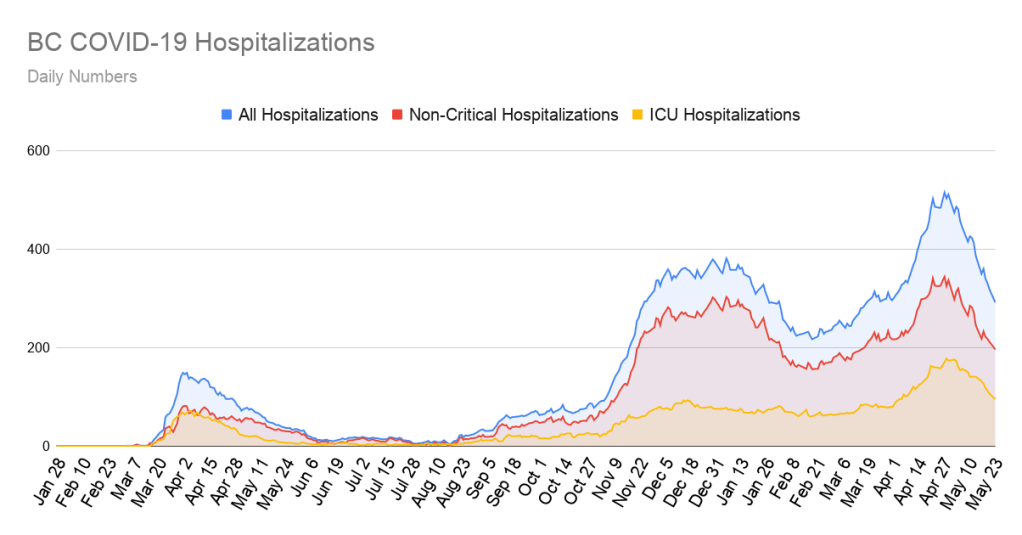
Currently, there are 292 people in BC hospitalized with COVID-19, and 96 of those are confined to the ICU. Non-critical hospitalizations are falling quite quickly now, and the ICU numbers are dropping almost as quickly!
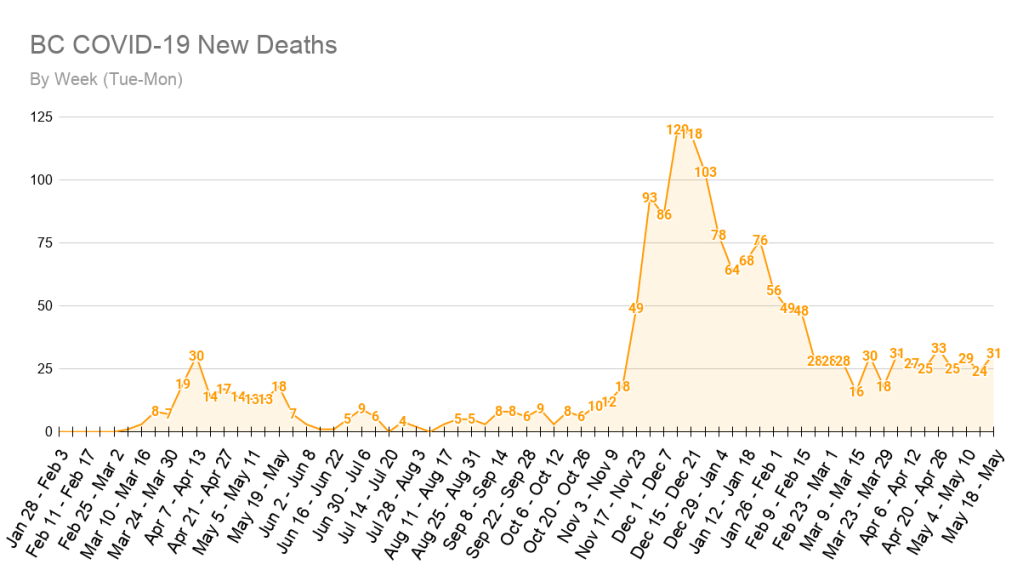
In the last 7 days, another 31 people in BC have died from COVID-19. The numbers have been sitting in the 16-30 (ish) range for a few months now, and this week’s numbers are no exception. Deaths always lag behind hospitalizations, so while this isn’t entirely unexpected, it is starting to feel like it has been dragging on a little longer than one might expect. Hopefully these numbers will see a dramatic decline very soon!
As always, our hearts go out to everyone who has lost someone during this pandemic.
Vaccination Roll-Out
Individual days may be +/- but the totals per week are accurate.
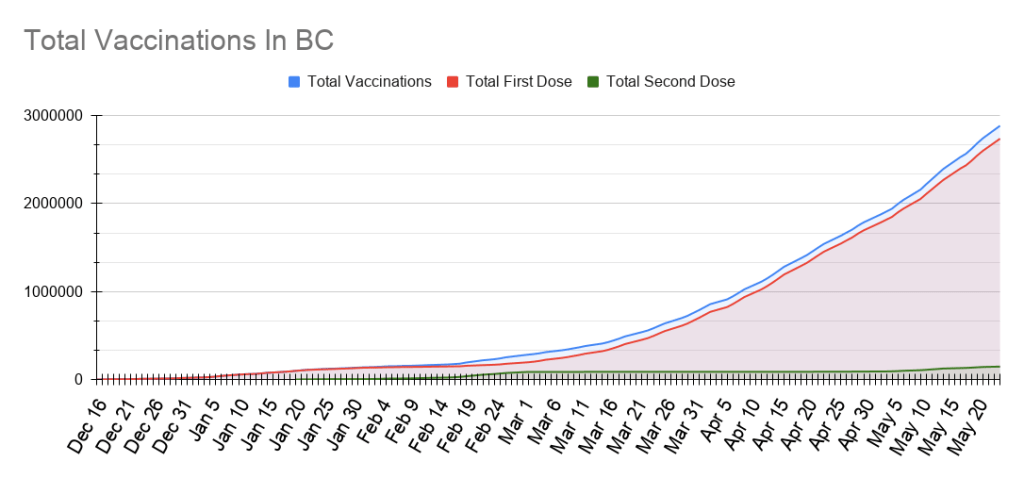
Since the beginning of our vaccination program on December 15th, there have been a combined 2,885,488 COVID-19 vaccinations in our province, with 147,144 of these being a person’s second dose. It’s very hard to tell on the graph currently, but second doses have begun to pick up again too! In the last 7 days, we averaged about 2,438 second doses a day.
As of today, 2,738,344 individuals have received at least 1 dose of vaccine, representing about 53.2% of BC’s total population (not to be confused with just the adult population, which we previously reported on). Roughly 6.6% of the people in BC received their first dose of vaccine in the last 7 days.
Please note that since the vaccination age restriction dropped to 12 and above, we are no longer able to report on the adults-only vaccination numbers. From now on we will only be able to report the total population percentage.
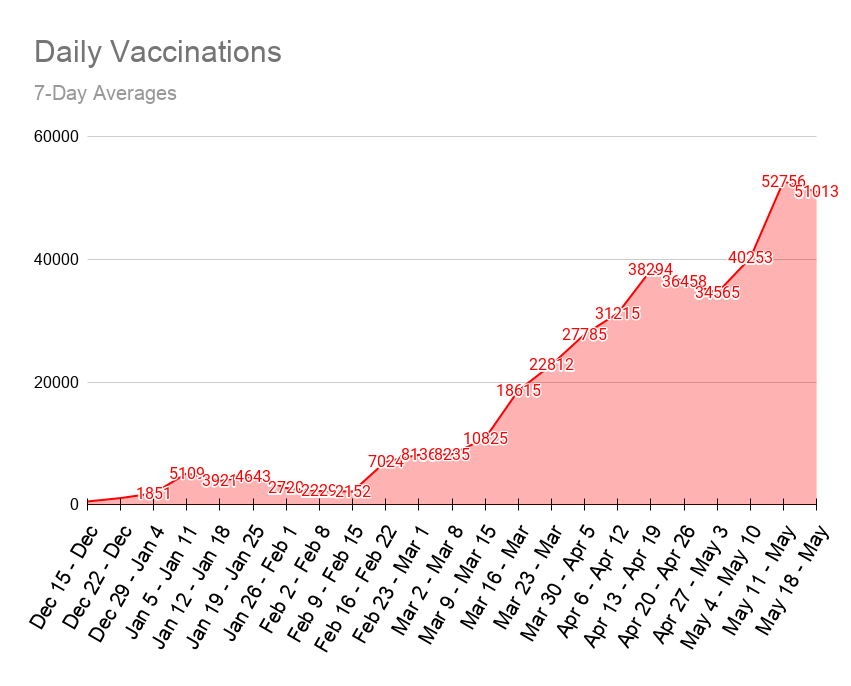
The above chart shows the average number of vaccinations for each 7-day period since the beginning of the vaccination program. As you can see in the last 7 days the daily average number of vaccinations in BC was 51,013. This is down a little bit from the previous week, but well within the same ballpark. We do expect the number to go up again in June though.
We are still on course for every 18+ person in BC to receive at least one dose of vaccine by July 1st. In fact, with the recent drop in age restriction, and the increase in supply we’re expecting in June, it’s very likely every person in BC aged 12 and over will be able to get their first dose by July 1st even.
Vaccination Roll-out Update
All people 12 and over are now able to register to be vaccinated. If you haven’t done this yet, please do as soon as possible!
For those aged between 12 and 17, or for those with children aged 12 to 17, you can find more information on adolescent vaccinations here. Public Health has made the process extremely easy for you!
There is still no new news on when the Johnson & Johnson vaccine may become available for us in BC (or anywhere in Canada). However, if a determination on it is not made in the next few weeks, it may no longer matter.
If you are looking for a way to promote vaccination, you may be interested in being part of the Canadian vaccination campaign: This is Our Shot. Information can be found here.
That’s all for now, stay safe everyone!
