
Weekly New Infections Charts
Every Monday we take a look at our week-to-week totals and chart how BC’s fight against COVID-19 is progressing. Because of the reporting schedule used in BC, we use 7-day totals running from Tuesday to Monday. The above chart shows each week of the pandemic as a unique bar.
As you can see from the above chart, in the last Tues-Mon 7 day period there has been another increase in new cases compared to the previous 7-day period. This is the fifth week in a row we have seen this happen, despite ongoing enhanced restrictions. The longest streak of increases we’ve seen in a row previously was 9, which took place between late September and late November of last year.
Of the 3804 new cases reported this week, 486 or 12.8% of them were determined to be variants of concern.

To better understand how the provincial numbers break down, we also look at the individual health authority regions.
The Fraser Health region has now seen 6 straight weeks of new case number growth, week to week. Its record for consecutive weeks of new case number growth currently sits at 7, from back last year in October and November. Thankfully, the Vancouver Coastal Health region has seen a small decline in new cases this past week.

It’s hard to tell due to lines overlapping in some areas, but the Vancouver Island Health region reported a slight decline in new cases in the previous week. Unfortunately, both the Interior and Northern Health regions reported more new cases than the last 7-day period. The Northern Health region especially seems to be locked in an up-and-down pattern, with no sustained improvements for over 3 months.
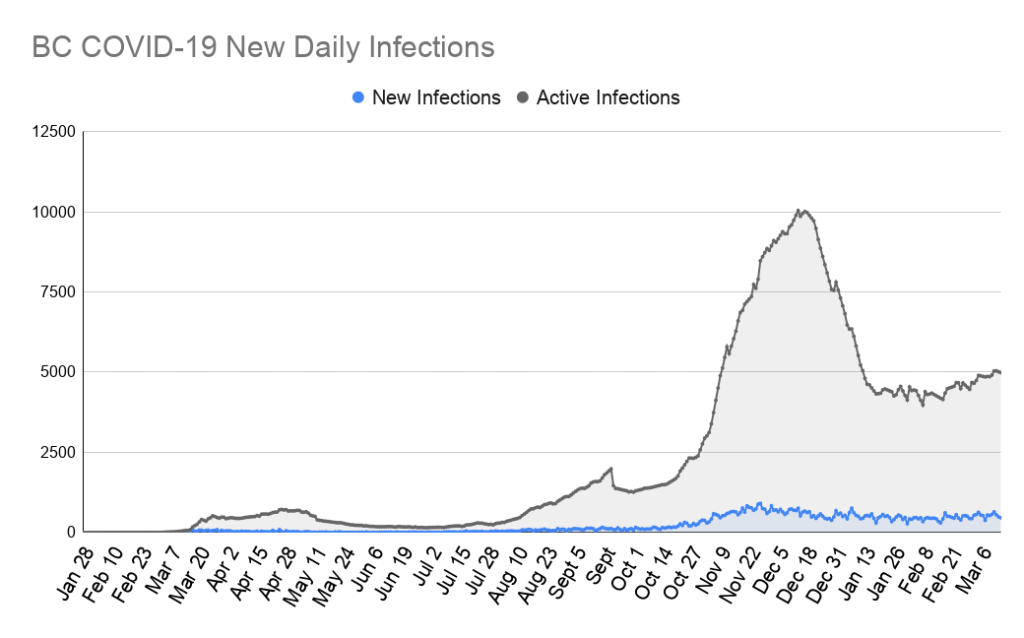
There are currently 4987 known active cases of COVID-19 in BC. This number represents an increase of about 100 active cases from this time last week. The number of active cases has been on a slow steady increase for several weeks now.
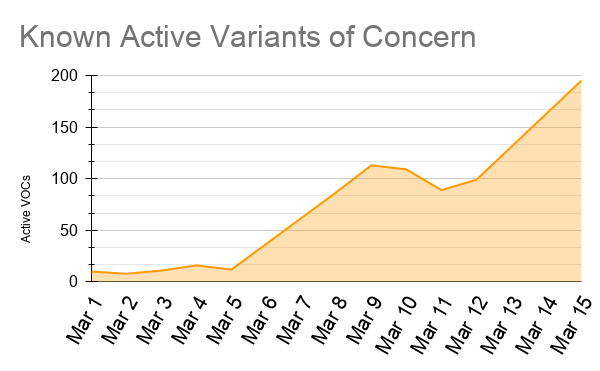
Unfortunately, today we also learned of another significant jump in active cases of COVID-19 Variants of Concern (VOC’s). On Friday, March 5th there were only 12 known active VOC cases in the province. Last Monday the number of known active VOCs jumped more than 700% to 87. This week that number more than doubled to 195 active variant cases.
We currently have known active cases of the B.1.1.7 (U.K.) variant, the B.1.351 (South Africa) variant, as well as the P.1 (Brazil) variant.
Week-to-Week Growth Rate

This graph tracks the growth rate between 7-day totals and is a good indicator of the overall momentum of new case numbers.
Our growth rate seems to be hovering just over the 0% growth line that we need it to be under. The good news is that despite all the variant cases, our growth rate is not exploding upward like it did when we had our second wave of cases. The bad news is that our new cases continue to increase, even if at a slower pace.
Hospitalizations & Deaths

Currently, there are 269 people in BC hospitalized with COVID-19, and 76 of those are confined to the ICU. These numbers are beginning to rise a little more significantly now. We haven’t seen this many people hospitalized or in the ICU since February 3rd and 4th respectively.
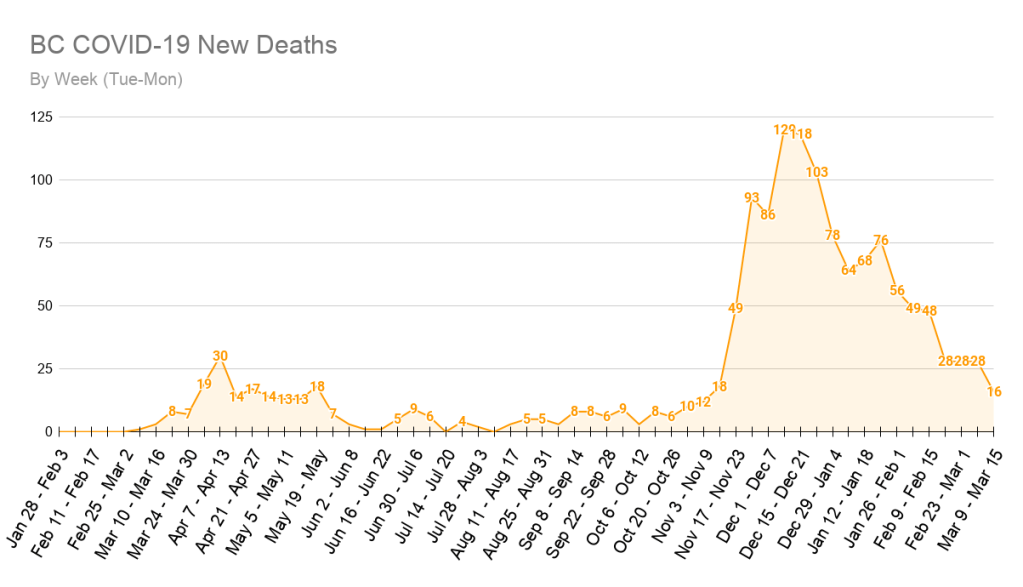
In the last 7 days, another 16 people in BC have died from COVID-19. This represents a large decrease in weekly deaths! This is the lowest our weekly death number has been since early November of last year. While it is important to celebrate this huge step in the right direction, it is important to not lose sight of the fact that even 1 death is too many. And with vaccinations continuing across the province, and more and more at-risk individuals being protected, we can hope to see this number drop even further soon!
Vaccination Roll-Out
Individual days may be +/- but the totals per week are accurate.
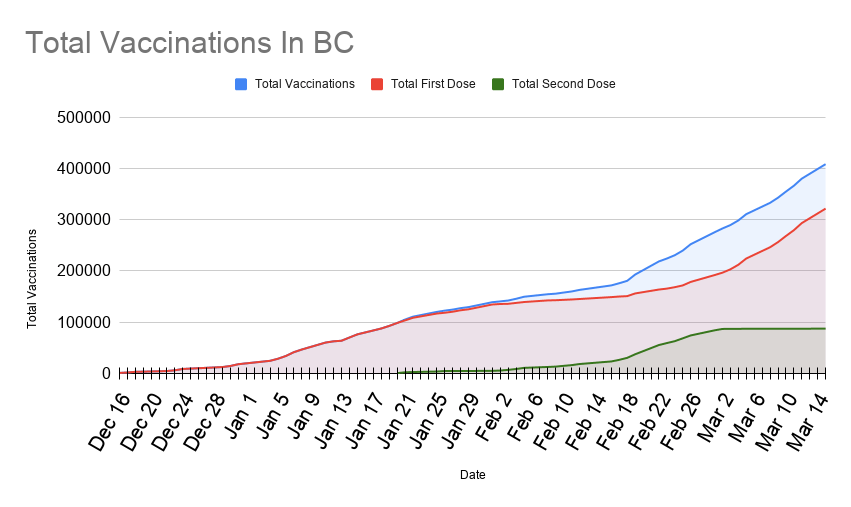
Since the beginning of our vaccination program on December 15th, there have been a combined 409,103 COVID-19 vaccinations in our province, with 87,059 of these being a person’s second dose. As you can see from the above graph, 2nd doses have now almost completely stalled in favour of vaccinating as many individuals as possible in the short term. As of today, 322,044 individuals have received at least 1 dose of vaccine, representing about 7.5% of BC’s population old enough to be eligible for the shots.
BC Public Health is expecting to be able to get all BC residents at least their first vaccine dose by July 2021. To help accomplish this, the second dose of vaccine has been pushed back from 6 weeks later, to 16 weeks later. More information about the vaccine roll-out plan can be found here.
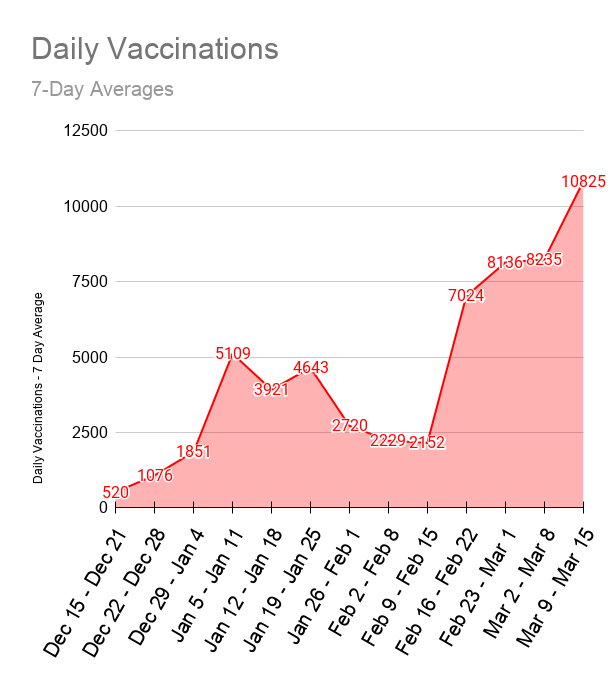
The above chart shows the average number of vaccinations for each 7-day period since the beginning of the vaccination program. As you can see in the last 7 days the daily average number of vaccinations given has once again jumped upwards and set a new record for the province! The number of vaccine doses received in Canada, as well as in BC specifically, continues to increase week-to-week.
AstraZeneca Update
There has been a lot of talk lately about AstraZeneca and the chance that it may be related to blood-clots forming in recently vaccinated people, in some parts of the world. In the hopes of calming some concerns, please consider the following related facts:
- There is currently no data confirming a relationship between blood clotting and the AstraZeneca vaccine.
- According to Dr. Bonnie Henry’s live briefing today, there have been about 35 reported cases of blood clotting out of roughly 17 million doses of AstraZeneca vaccine administered. None of these occurred in Canada.
- One of the symptoms of COVID-19 is blood clotting, which the vaccine is extremely effective at preventing severe cases of.
- Birth control is known to cause blood clotting at a rate greater than 100x that of what the AstraZeneca vaccine might cause (in a worst-case scenario).
So when Dr. Bonnie Henry says that the vaccine is safe and recommends it, know that she is looking at all the data, and is giving you the best advice. Please do not put too much faith in shock headlines and anti-vaxxers trying to exaggerate the situation.
That’s all for now, stay safe everyone!
