
Weekly New Infections Charts
Every Monday we take a look at our week-to-week totals and chart how BC’s fight against COVID-19 is progressing. Because of the reporting schedule used in BC, we use 7-day totals running from Tuesday to Monday. The above chart shows each week of the pandemic as a unique bar.
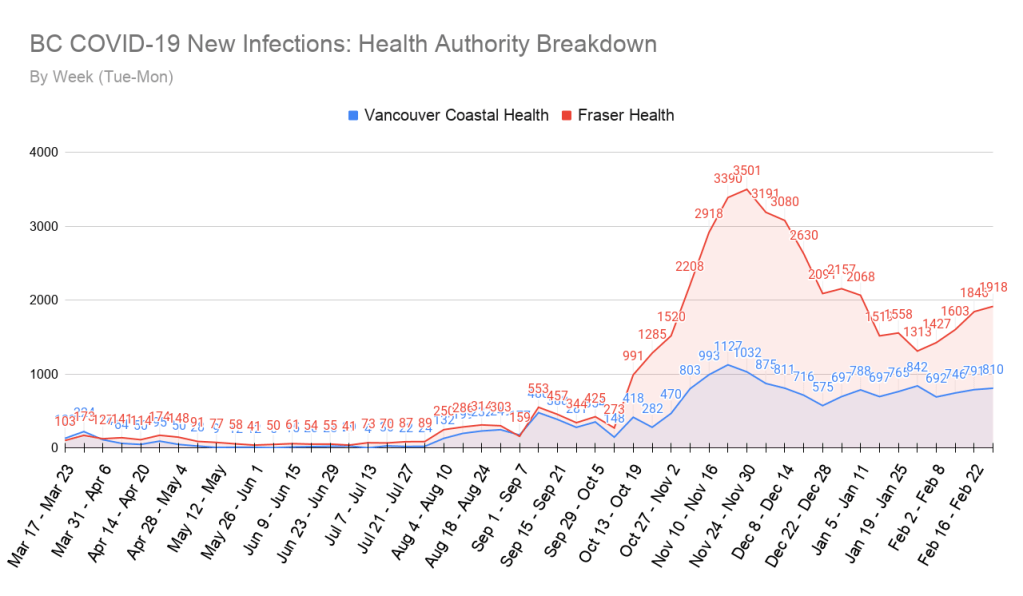
As you can see from the above chart, in the last Tues-Mon 7 day period there has been another increase in new cases compared to the previous 7-day period. This is the third week in a row we have seen this happen, despite ongoing enhanced restrictions.
To better understand how the provincial numbers break down, we also look at the individual health authority regions.
The Fraser Health region saw a significant increase in new case numbers in the last 7 days compared to the previous week. With ~1918 new cases (uncertainty due to the reporting error on Friday), the Fraser Health region continues to represent more than half of all new cases reported in BC in the last week. The Vancouver Coastal Health region also saw an increase in new case numbers, but the numbers there still seem to be fluctuating back and forth around the same average.
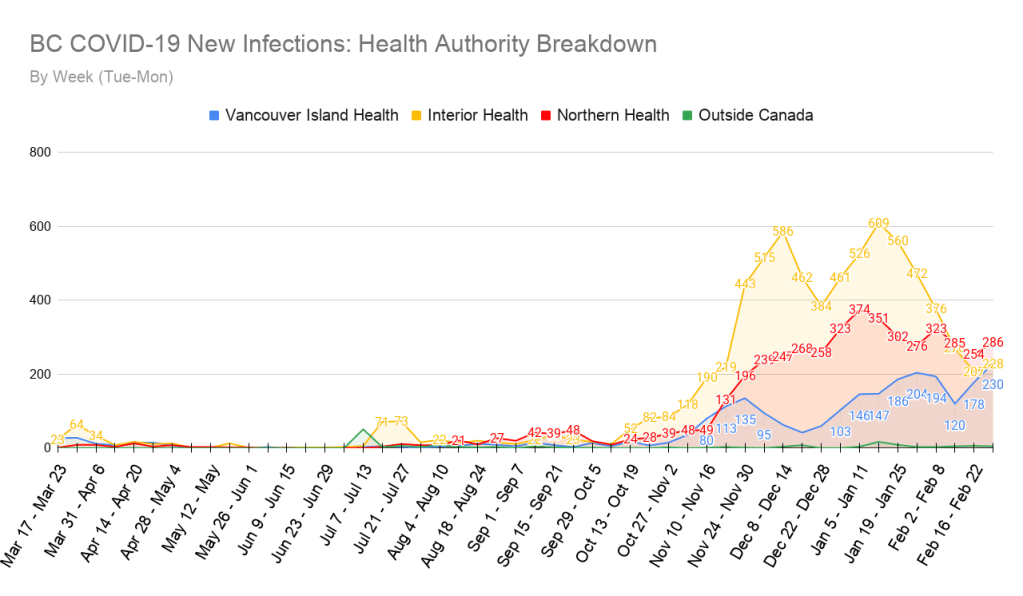
The above graph shows all 3 health regions saw an increase in new cases over the previous 7 days. Perhaps the most concerning of the 3 regions pictured above is Vancouver Island, which is currently seeing the highest 7-day numbers it has experienced throughout the entire pandemic.

There are currently 4464 known active cases of COVID-19 in BC. This number represents a drop of about 100 active cases from this time last week. We are still seeing increases in new cases, so it is likely the number of ongoing active cases will continue to slowly increase over time, until we can get our growth rate back into the negative again.
Week-to-Week Growth Rate

This graph tracks the growth rate between 7-day totals and is a good indicator of the overall momentum of new case numbers.
Some good news! Even though our numbers are still increasing, in the last 7-days, they have been increasing at a slower rate than the previous weeks. If we can make this a trend, we could see a return to a negative growth rate again in 1-2 weeks. As it stands are growth rate is sitting at 3.9%, just a short hop above the ever-important 0% line.
Hospitalizations & Deaths

Currently, there are 236 people in BC hospitalized with COVID-19, and 65 of those are confined to the ICU. These numbers are a little higher than they were last week at this time, but they continue to fluctuate up and down and trending slightly upward overall.

In the last 7 days, another 28 people in BC have died from COVID-19, which is the same number we saw last week. It is a little disheartening to see this number fail to drop for a 5th consecutive week, but with the vaccination program ramping up, we hope to see this number drop much further in the coming weeks and months. As always our hearts go out to all those who have lost a friend or loved one over the course of the pandemic.
Vaccination Roll-Out

Individual days may be +/- but the totals per week are accurate.
Since the beginning of our vaccination program on December 15th, there have been a combined 275,681 COVID-19 vaccinations in our province, with 83,777 of these being a person’s second dose. The focus is now moving away from health care workers and care-home residents/staff, as that part of the program is nearly complete. We are now moving into Phase 2 of the vaccine roll-out plan:

BC Public Health is expecting to be able to get all BC residents at least their first vaccine dose by July 2021. To help accomplish this, the second dose of vaccine has been pushed back from 6 weeks later, to 16 weeks later. More information about the vaccine roll-out plan can be found here.
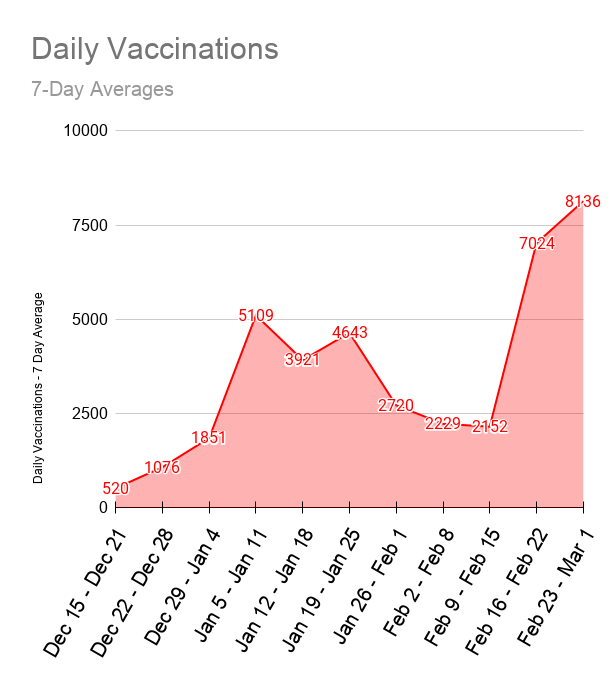
The above chart shows the average number of vaccinations for each 7-day period since the beginning of the vaccination program. As you can see in the last 7 days the daily average number of vaccinations given has once again jumped upwards and set a new record for the province! The number of vaccine doses received in Canada, as well as in BC specifically, is expected to continue increasing from this point onward, especially with the recent approval of a third vaccine option from AstraZeneca.
That’s all for now, stay safe everyone!

Thanks Greg! I hope you are well! Nice to see Interior Health taking a dive! I hope it stays that way especially after Spring break! Stay safe! Your reports are the best and I appreciate your hard work.
LikeLike