
Weekly New Infections Charts
Every Monday we take a look at our week-to-week totals and chart how BC’s fight against COVID-19 is progressing. Because of the reporting schedule used in BC, we use 7-day totals running from Tuesday to Monday. The above chart shows each week of the pandemic as a unique bar.
As you can see from the above chart, in the last Tues-Mon 7 day period there have been slightly more new cases of COVID-19 than the previous 7-day period. The increase itself is quite minimal, averaging at only 2 additional cases per day, but the change in direction is concerning regardless. We have previously been told that the current enhanced social restrictions will not be lifted until the number of new cases and transmission events come down significantly.

To better understand how the provincial numbers break down, we also look at the individual health authority regions.
The Fraser Health region saw a significant increase in new case numbers in the last 7 days compared to the previous week. At 1603, the Fraser Health region represents more than half of all new cases reported in BC in the last week. This increase is despite the fact that there are now only 8 active outbreaks in the Fraser Health region, almost half the number that was active at the end of last week’s 7-day period. The Vancouver Coastal Health region also saw an increase in new case numbers, but the numbers there seem to be fluctuating back and forth around the same average still.
The good news is that the Interior Health region has seen its new case numbers plummet! They have seen their 7-day total drop from its high of 609 in January, to just 270 now. They have done a great job in getting their numbers down!
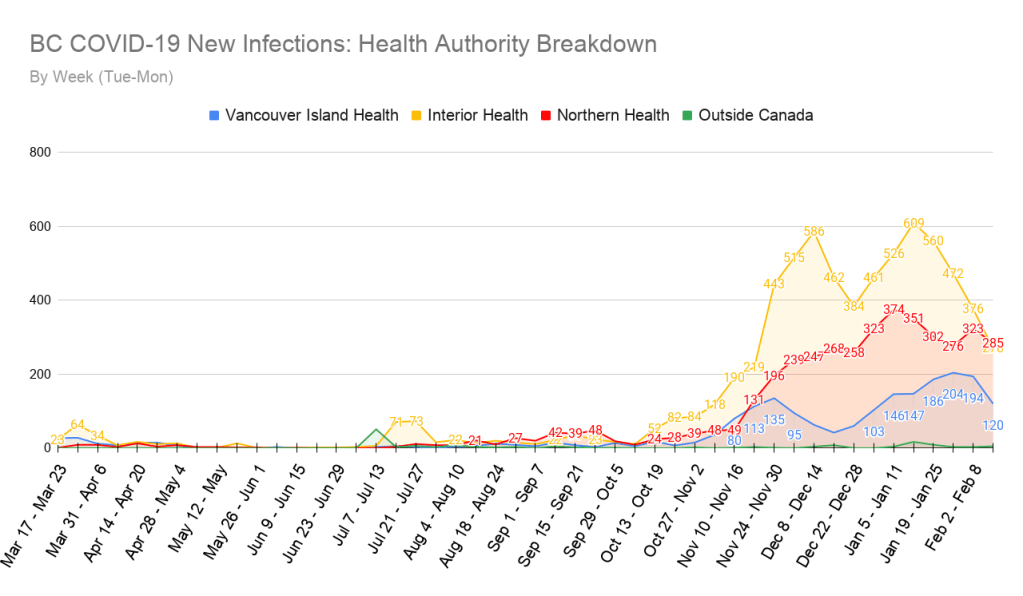
The above graph shows us that both the Northern Health region and the Vancouver Island Health region, have seen decreases in their new case numbers over the last 7 days. The Vancouver Island Health region, in particular, has seen a dramatic drop in its new cases.
It’s also worth mentioning that the Interior Health region has seen its number drop so much in the last week, that it is now below that of the Northern Health region!

There are currently 4189 known active cases of COVID-19 in BC. The number of active cases seems to be slowly trending downward still, but frequently fluctuates back and forth in the process.
Week-to-Week Growth Rate

This graph tracks the growth rate between 7-day totals and is a good indicator of the overall momentum of new case numbers.
In the last 7 days, our new case numbers started to slowly rise again, but the rate at which they are rising is a minuscule 0.5% compared to the previous 7-day period. It is concerning to see our growth rate return to the positive, even if it such a small amount. Our province continues to remain on the edge, and whether we will see a return to increased growth rate or a further decline, depends on all of us to do our part.
Hospitalizations & Deaths
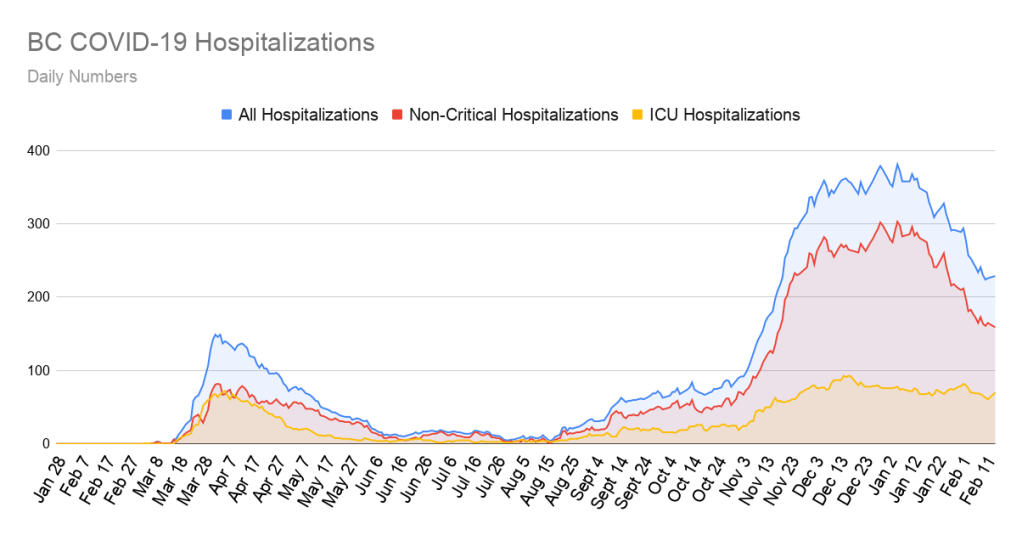
Currently, there are 231 people in BC hospitalized with COVID-19. The number of people hospitalized has begun to slowly increase again, and the number of people in ICU spiked upward from just 61 on February 12th to 74 today. It is especially concerning to see the ICU numbers increase again in such a short period of time.
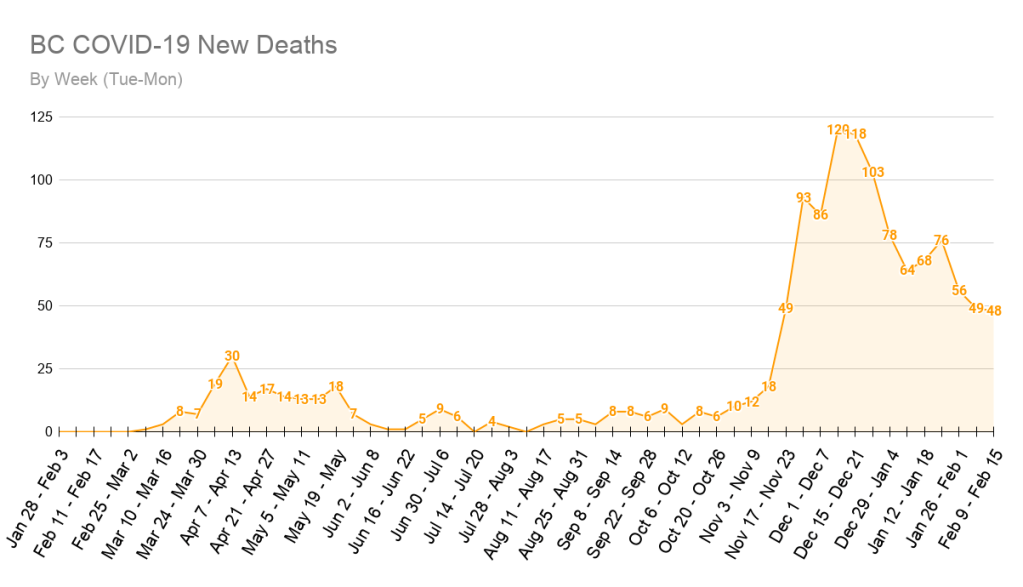
In the last 7 days, another 48 people in BC have died from COVID-19, 1 fewer than died in the previous 7-day total. This continues to be the lowest our 7-day deaths total has been since November of last year. Hopefully, this number will continue to drop, especially as vaccination numbers increase among the most at-risk. As always, our hearts go out to all those who have experienced loss during these trying times.
Vaccination Roll-Out

Individual days may be +/- but the totals per week are accurate.
Since the beginning of our vaccination program on December 15th, there have been a combined 171,755 COVID-19 vaccinations in our province, with 22,914 of these being a person’s second and final dose. The focus is currently on health care workers and those deemed to be at the highest risk, primarily in care homes.

The above chart shows the average number of vaccinations for each 7-day period since the beginning of the vaccination program. As you can see in the last 7 days the daily average number of vaccinations given has flattened and is no longer dropping significantly week-to-week. We have also been informed that a large shipment of the BioNTech/Pfizer vaccine has recently arrived in BC, and more is on the way for later this week. We should be seeing a return to higher vaccination numbers again shortly, as the roll-out continues.
That’s all for now, stay safe everyone!
