
Weekly New Infections Charts
Every Monday we take a look at our week to week totals and chart how BC’s fight against COVID-19 is progressing. Because of the reporting schedule used in BC, we use 7-day totals running from Tuesday to Monday. The above chart shows each week of the pandemic as a unique bar.
Last Monday in her live briefing Dr. Bonnie Henry mentioned that our new case numbers have stalled at approximately 500 cases a day. In the last 7 days, BC has managed to drop our daily average to roughly 445 cases. While this is an improvement over the 5 weeks preceding it, our numbers are still not dropping very quickly.
BC’s enhanced restrictions are scheduled to expire on Friday this week, and it remains to be seen if Dr. Bonnie Henry will extend them further or not. The next live briefing event is also scheduled for Friday, and we are told to expect new modelling data along with a decision regarding the current restrictions.
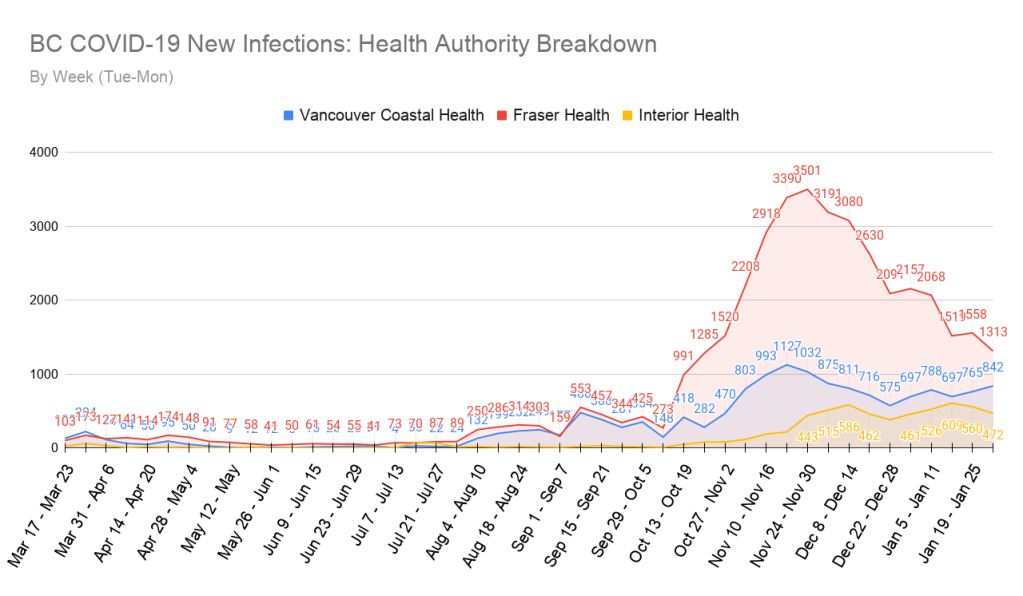
To better understand how the provincial numbers break down, we also look at the individual health authority regions.
In the last 7 days, the Fraser Health region has seen their new case numbers drop to around the same level they were at during Halloween last year. This is a massive improvement, although it has taken a while to get there. Unfortunately, the same can not be said for the Vancouver Coastal or Interior Health regions, both of which have been fluctuating back and forth around the same higher numbers since late November.
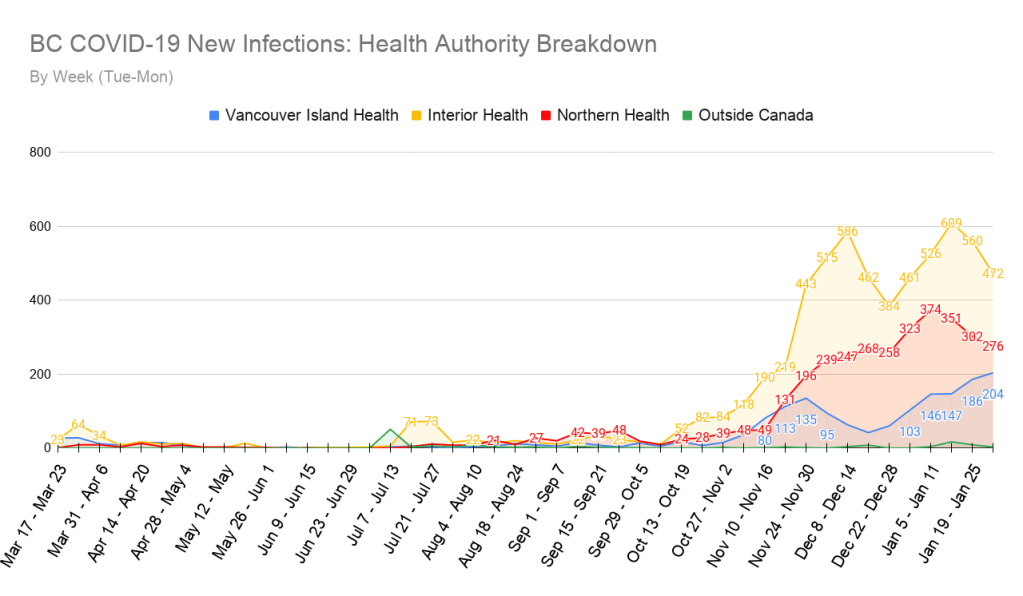
The above graph shows us that the Northern Health region has now been seeing declines in their new case numbers for 3 weeks running. This is a good sign that things may be getting back under better control in that area. The Vancouver Island Health region is headed in the opposite direction, unfortunately, with the last 6 weeks showing continued new case number growth. Out of all the health regions in BC, Vancouver Island is the only area experiencing their worst new case numbers of the pandemic currently.

There are currently 4134 known active cases of COVID-19 in BC. This number is the lowest we’ve seen since November 7th last year. While the number of active cases in BC continues to drop, it has been fluctuating around these numbers since mid-January.
Week-to-Week Growth Rate

This graph tracks the growth rate between 7-day totals and is a good indicator of the overall momentum of new case numbers.
In the last 7 days, we have seen a return to a negative growth rate, currently sitting at -8.0%. While this is excellent news, and exactly the direction we need our growth rate to move in, the numbers have been fluctuating back and forth since the start of the year. We need to achieve multiple weeks of consistent negative growth in order to make a real difference in our weekly numbers, and effectively bend our curve back down.
Hospitalizations & Deaths
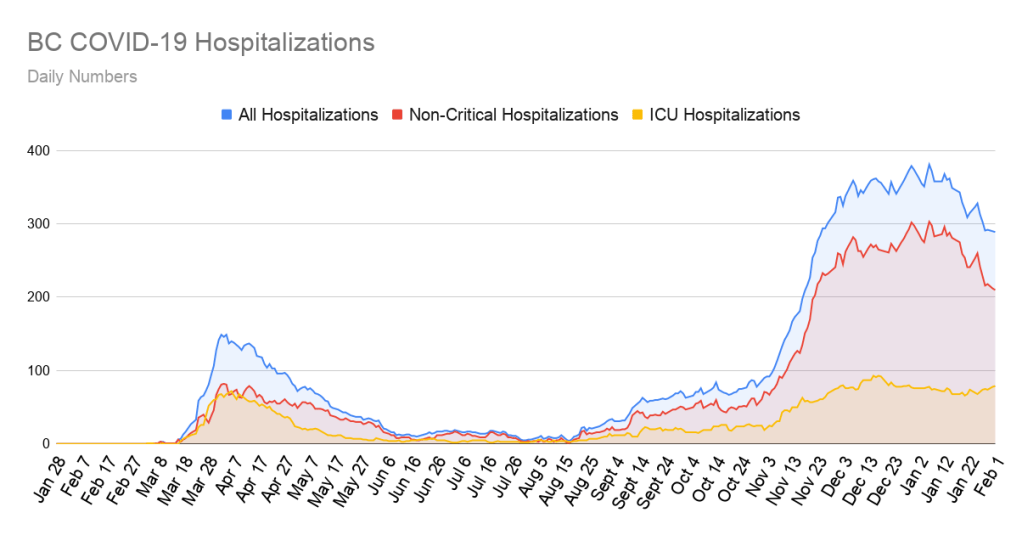
Our hospitalization numbers are the lowest they have been since November 24th, with 289 people currently hospitalized with COVID-19. Unfortunately, our intensive care numbers have been creeping upwards for almost 2 weeks, with the current number now sitting at 79.
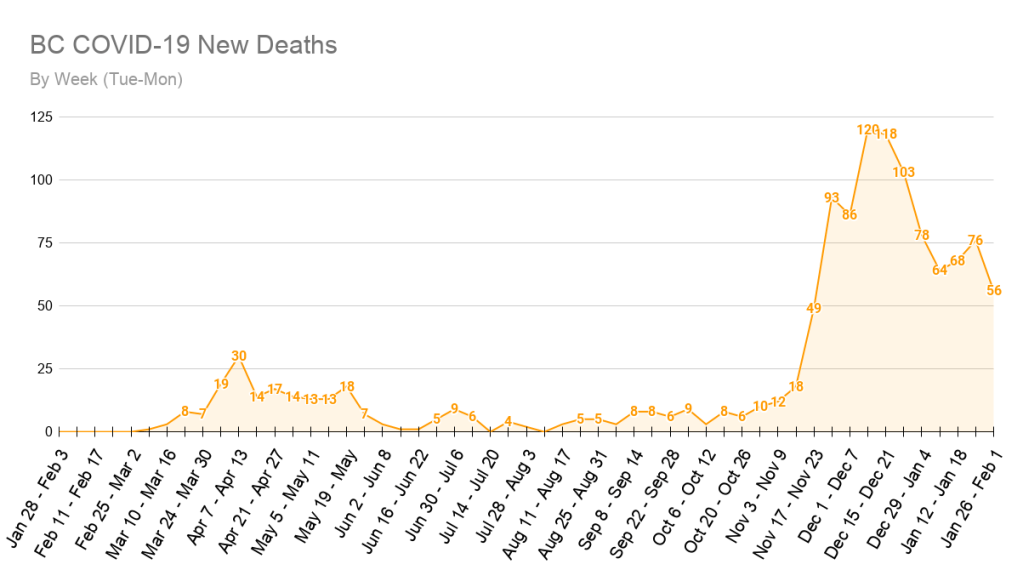
In the last 7 days, another 56 people in BC have died from COVID-19, 20 fewer than died in the previous 7-day total. This is the lowest our 7-day deaths total has been since November of last year. Of course, even 1 death is too many, and we join our thoughts and heartbreak with everyone who has experienced this tragic loss.
Vaccination Roll-Out
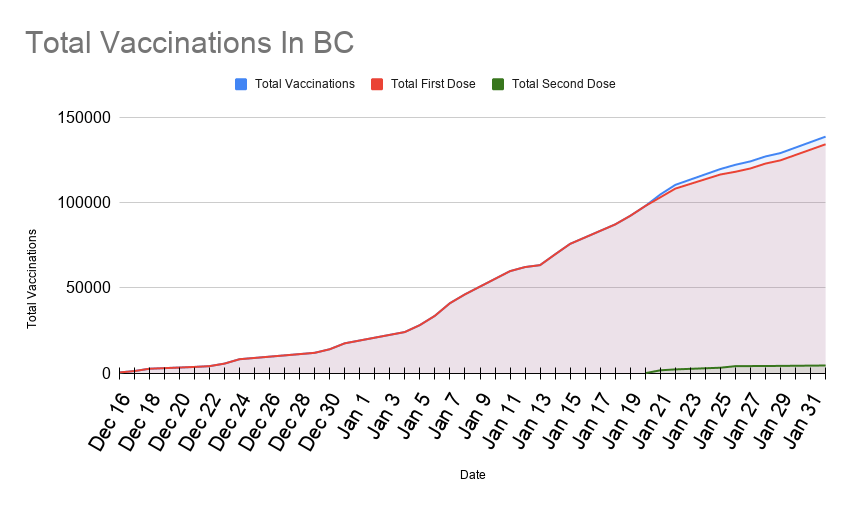
Individual days may be +/- but the totals per week are accurate.
Since the beginning of our vaccination program on December 15th, there have been a combined 138,892 COVID-19 vaccinations in our province, with 4491 of these being a person’s second and final dose. The focus is currently on health care workers and those deemed to be at the highest risk, primarily in care homes.
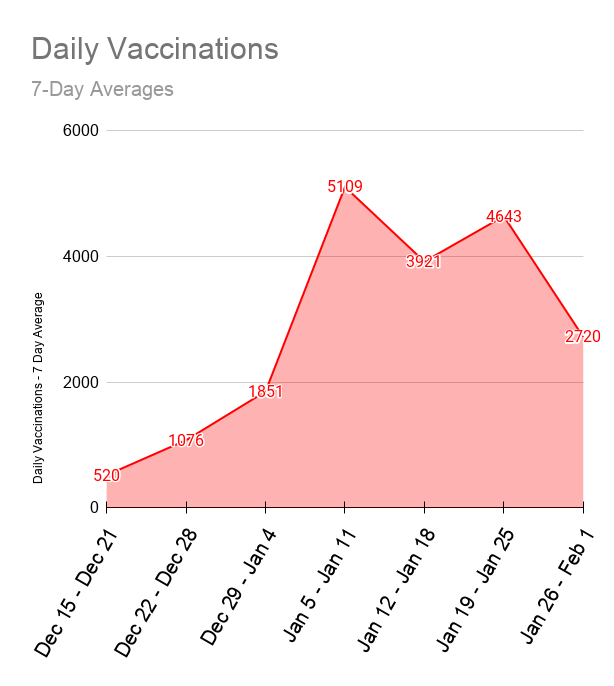
The above chart shows the average number of vaccinations for each 7-day period since the beginning of the vaccination program. As you can see in the last 7 days the province has continued to run into significant shortages with vaccine supplies, a problem that is expected to continue over February.
Some good news, however, is that every care home in the province has now been visited by immunization officers, and most residents have now received their initial dose of vaccine. Vaccinations in care homes will continue, and we have been told that those offered the vaccine have accepted it at a rate approaching 100%!
That’s all for now, stay safe everyone!
