Weekly New Infections Charts
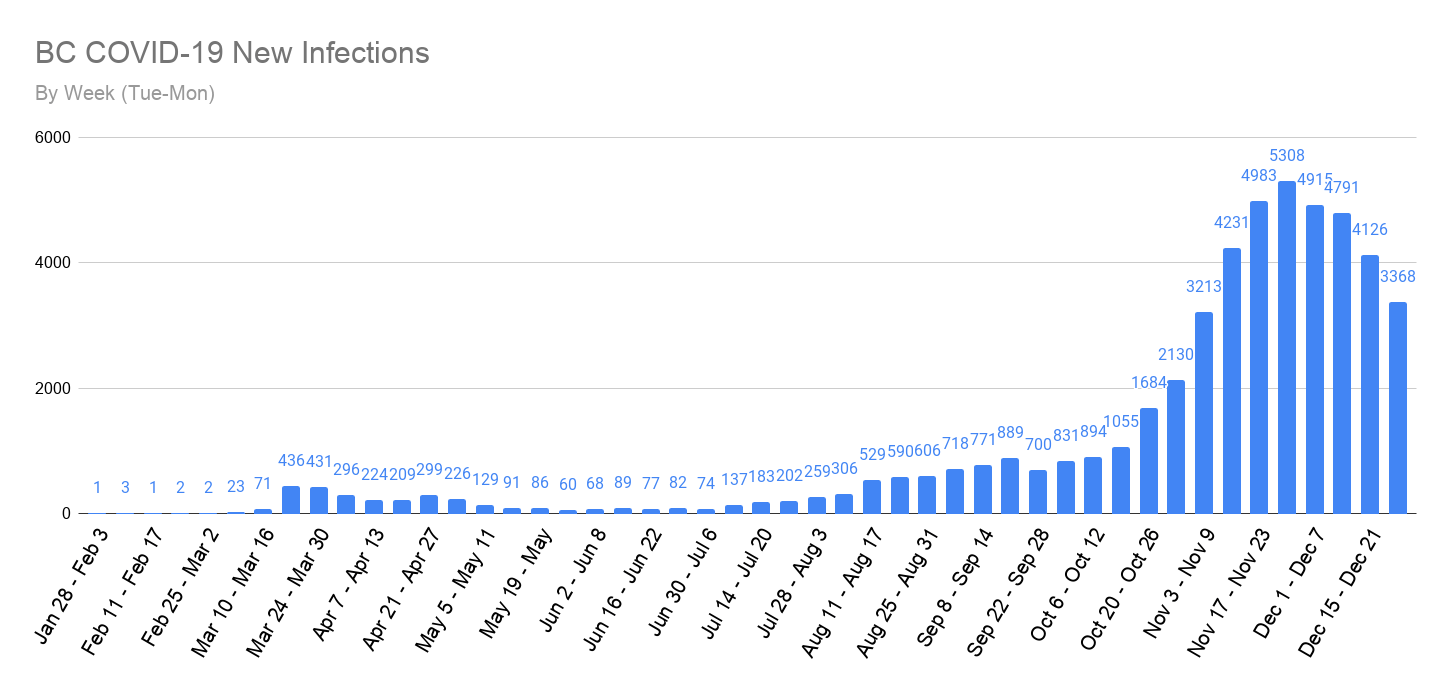
Every Monday we take a look at our week to week totals and chart how BC’s fight against COVID-19 is progressing. Because of the reporting schedule used in BC, we use 7-day totals running from Tuesday to Monday. The above chart shows each week of the pandemic as a unique bar.
We have now seen our week-to-week new case numbers drop for 4 weeks in a row, with our current Tuesday to Monday 7-day total sitting at 3368. This is 758 fewer cases than the previous 7-day total or about 108 fewer cases per day on average. It has now been 4.5 weeks since we last saw the record broken for most new cases reported for a single day. The current record remains 911, set on November 27th.
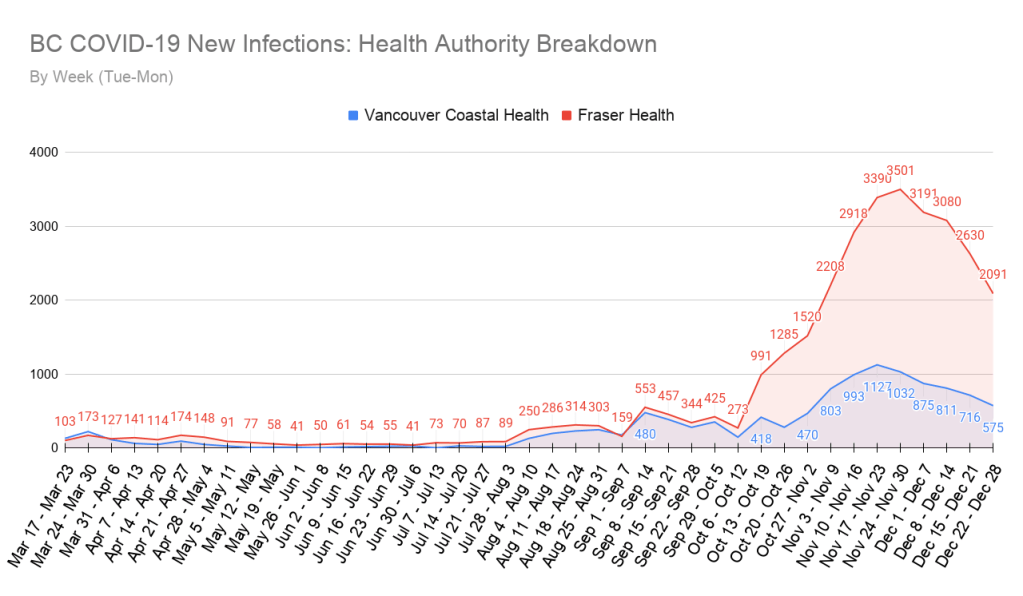
To better understand how the provincial numbers break down, we now also look at individual health authority regions. In the last 7-days, the Fraser Health region’s new infection numbers have continued their steep dive, but still remain by far the highest numbers of all the health regions in BC. New case numbers in the Vancouver Coastal Health region also continue to decline steadily.
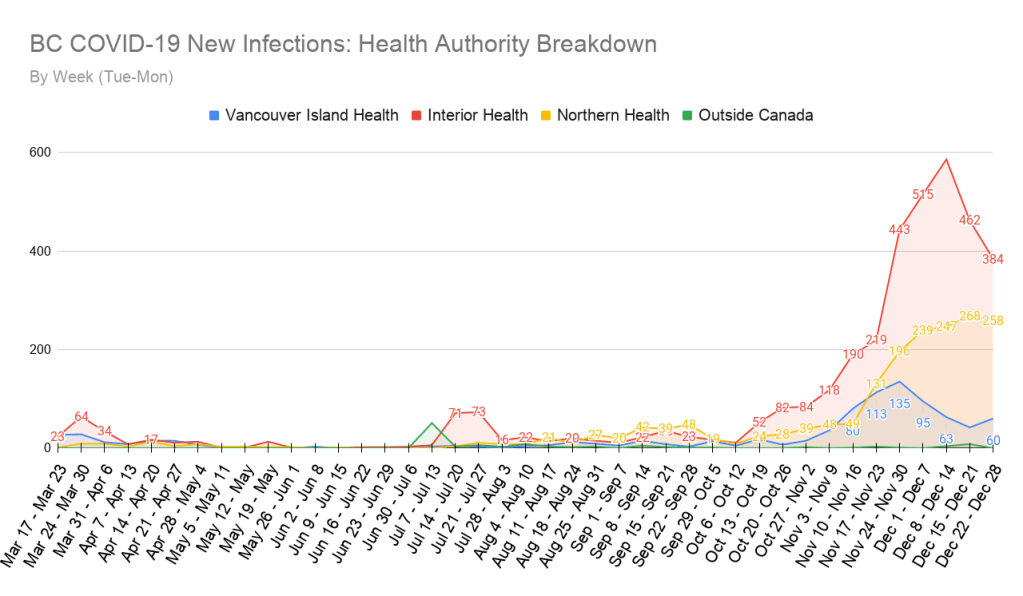
The Interior Health region’s new case numbers have been in significant decline for 2 weeks now, at a rate that could see their 7-day totals drop below those of the Northern Health region in the next several weeks perhaps. The Interior Health region looks like its new case growth rate is now flattening out, and may now be declining ever so slightly.
Unfortunately, we see that the Vancouver Island Health region has begun to see an increase in new case numbers again. This is also the area where the highly contagious B.1.1.7 variant has been found in BC, but hopefully, these two facts are unrelated.
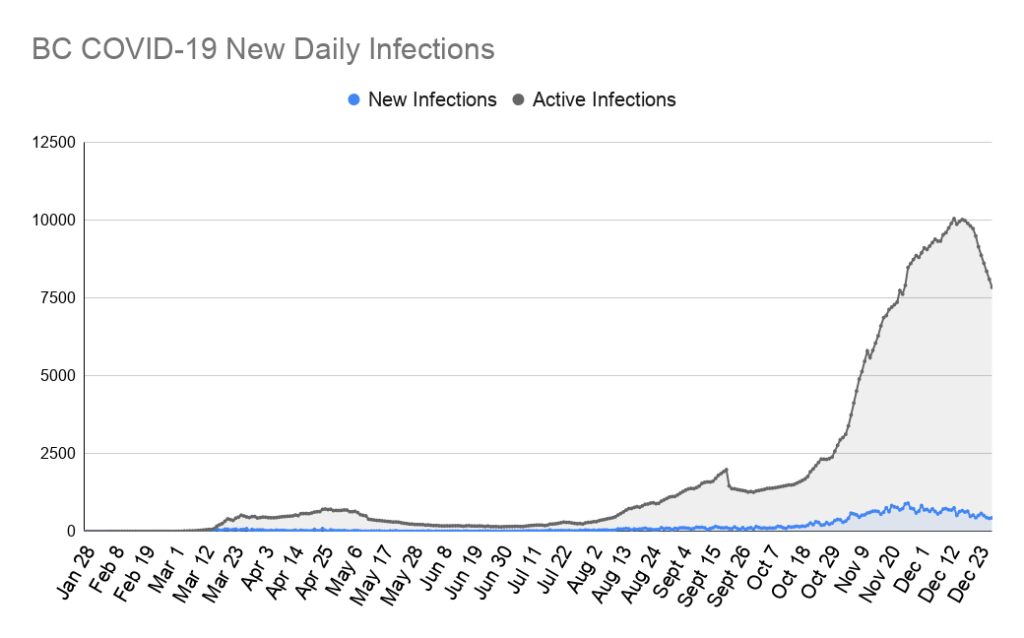
There are now 7580 active COVID-19 infections in BC, which is the lowest they have been in 36 days. It is also 2138 fewer active cases than we reported last Monday. The number remains much higher than anyone would like to see it at, but it currently appears to be dropping at an impressive rate.
Week-to-Week Growth Rate

We continue to see negative growth rates on our week-to-week comparison chart. Looking exclusively at the above data would give us a very positive impression of our current new case numbers. But in her live briefing this afternoon, Dr. Bonnie Henry mentioned that over the last week or so, testing numbers had taken a steep dive, giving her reason for concern that people may have been avoiding getting tested before Christmas celebrations.

We can see from the above charts (Courtesy of the BC COVID-19 Dashboard website) that testing numbers dropped from around 15k a day, to between 4k and 8k a day. Meanwhile, the 7-day rolling average for our province’s test-positive rate has jumped to an all-time high of 7.9%. Before this week, the record high for our 7-day rolling test-positive rate was 6.8%. It is too soon to know what this could mean for our new case numbers in the future, but in general, we want the test-positive rate to be around the 2% mark or lower.
Hospitalizations & Deaths

Our ICU numbers still seem to be slowly trending lower, but unfortunately, it looks like our overall hospitalization numbers are slightly increasing, or at best holding steady. Since our new case numbers have been in decline for some time now, we expected these numbers to have dropped more substantially by now.
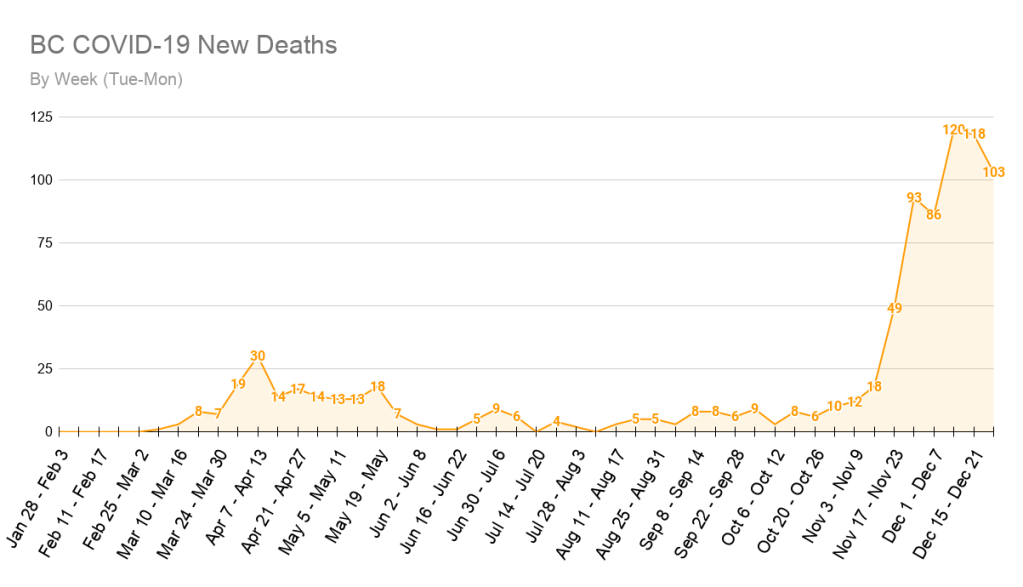
In the last 7-days, another 103 people in BC have died from COVID-19. This is a significant drop from the previous 2 weeks but still remains at disturbing and unacceptable heights. Hopefully between our new case numbers continuing to drop, and vaccinations of the most at-risk being ramped up further, we can get this number down as low as possible, very quickly!
That’s all for now, stay safe everyone!
