
Weekly New Infections Charts
Every Monday we take a look at our week to week totals and chart how BC’s fight against COVID-19 is progressing. Because of the reporting schedule used in BC, we use 7-day totals running from Tuesday to Monday. The above chart shows each week of the pandemic as a unique bar.
Today we have some much needed good news! For the first time since September, our 7-day week-to-week total new case numbers have gone down! This is a testament to the restraint and hard work of all the people in our province who are following the public health orders to keep physically distanced from those who are not part of their regular household, and to execute the necessary safety measures when they need to go out.
For the first time since the beginning of October, in the previous 7-days, we did not see a new record set for the most new cases reported for a single day.

If we take a look at how the numbers break down by health authority we can see that both the Vancouver Coastal and Fraser areas are seeing significant declines in week-to-week new case totals. Fraser Health specifically has taken a very sharp turn downwards, and it is very encouraging to see this occur after so many weeks of straight increases.
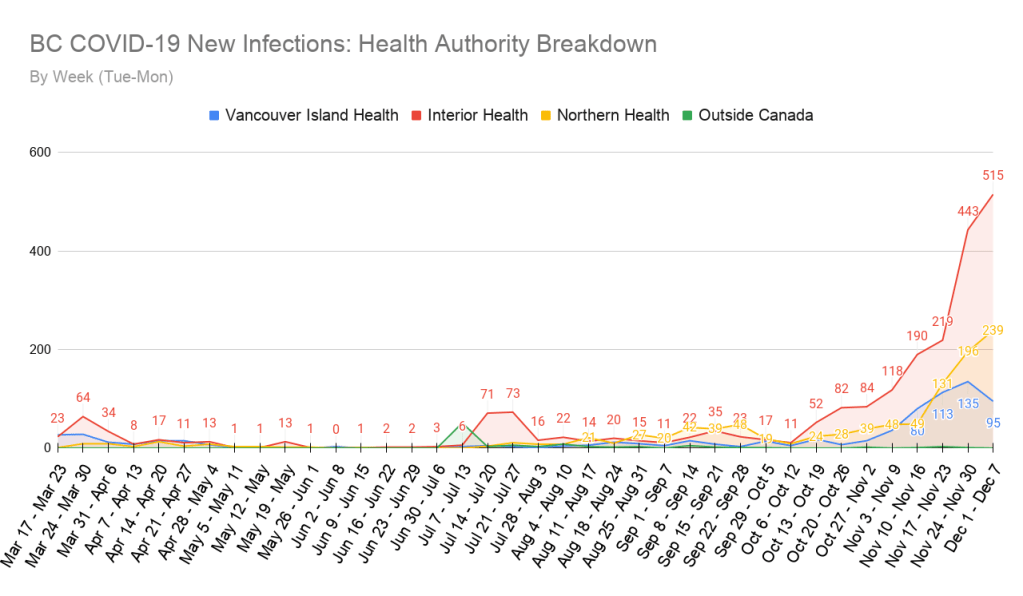
The Vancouver Island health area is similarly showing significant improvements over the previous week, and their numbers are now in a sharp decline.
Bother Northern and Interior health areas unfortunately are still showing consistent growth week-to-week, but there is hope that this is primarily caused by recent outbreaks. If this proves to be the case, we should see both health areas’ new case numbers begin to drop soon as well.

There are now 9380 active COVID-19 infections in BC, which is also the record for the most there have ever been. This number tends to lag behind any major changes in new case numbers, as the incubation period of the virus is about 2 weeks. If our numbers continue to decline, we should expect to see this number begin to decline as well in 1-2 weeks.
Week-to-Week Growth Rate

We now have 4 straight weeks of week-to-week growth rate decline in BC’s new case numbers. This is extremely encouraging and represents one of the longest positive streaks our province has seen in many months. While a -7.4% growth rate is not the biggest drop in new case numbers we’ve seen, it is arguably one of the most important ones. Turning the corner on our new case number growth rate has been the primary goal of public health, and over the next few weeks, we should see this translate into fewer active cases, fewer hospitalizations, and fewer deaths. And not only that, but the turn in numbers also came at a time before our hospitals and contact tracing teams were completely overwhelmed. We are extremely lucky in that regard.
Hospitalizations & Deaths
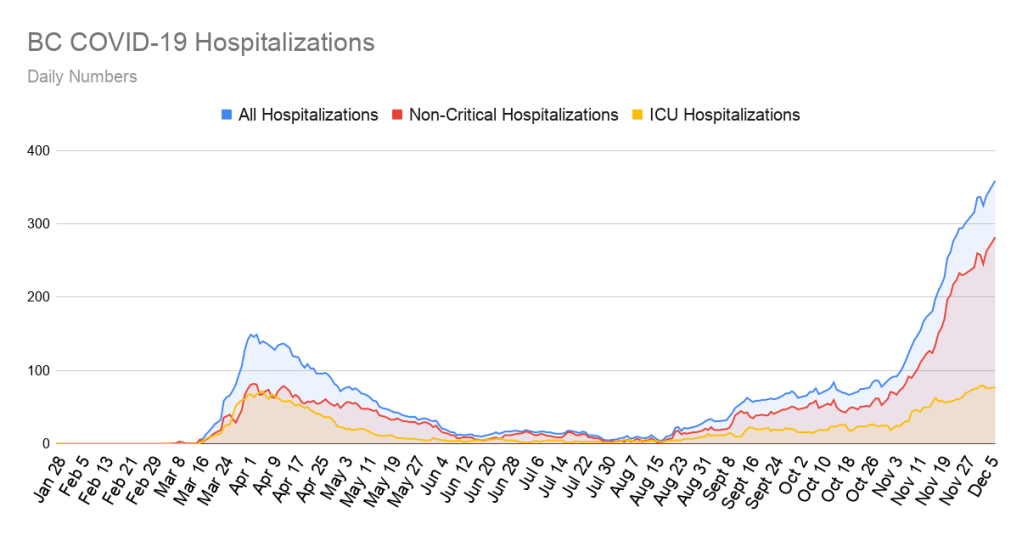
The number of active hospitalizations in our province continues to increase steadily. We also saw the record for the most number of COVID-19 patients in ICU increase to 80 as of December 3rd. However, since that time the number of patients in ICU has gone down to 77. As mentioned above, hospitalizations usually trail the new case numbers by a few weeks, so hopefully, we will begin seeing a decrease in numbers soon.

In the last 7-days, another 86 people in BC died from COVID-19. Many of these people were in long term care, and our hearts go out to them, and everyone that has died in this pandemic, and their families. The number of weekly deaths has decreased from the previous week’s total, but our numbers remain quite high. Hopefully, the decrease in numbers becomes a fast trend, and we can get that number as close to 0 as possible again.
Simulated Case Number Projections
With today’s announcement that the public health orders will be kept in place until at least January 8th, and because of the unusually steady week-to-week growth rate decline we’ve seen over the last 4 weeks, we had a unique opportunity to simulate what BC’s numbers might look like over the next 5 weeks.
THIS IS NOT A PREDICTIVE PROJECTION
The following charts are representative of a possible situation only. We can not predict the future, but we can tell you what the numbers would be if the same trend we’ve seen over the last 4 weeks continues over the next 5 weeks. They do not account for increased house parties over New Year’s Eve, or people breaking public health orders at Christmas, or businesses allowing risky behaviour in-store for Boxing Day sales. There are many reasons and ways that these numbers could not happen.
However, we hope that you will look at these numbers as more of a challenge, and encouragement for “good behaviour”. It is a realistic opportunity for us to get back to a much safer place, right in time for the first rounds of vaccine making their way here. So without further ado:


In the above charts, you will find the possible projected lines and bars in YELLOW and the existing lines and bars in RED and BLUE. As you can see, if the growth rate of new cases continues to decline at the rate it has been, we could see a weekly total of just 109 new cases come January 11th. For many of us, it may feel like an impossibility to see numbers like that again, but it’s not as unrealistic as it may seem.
Vaccine Watch Update
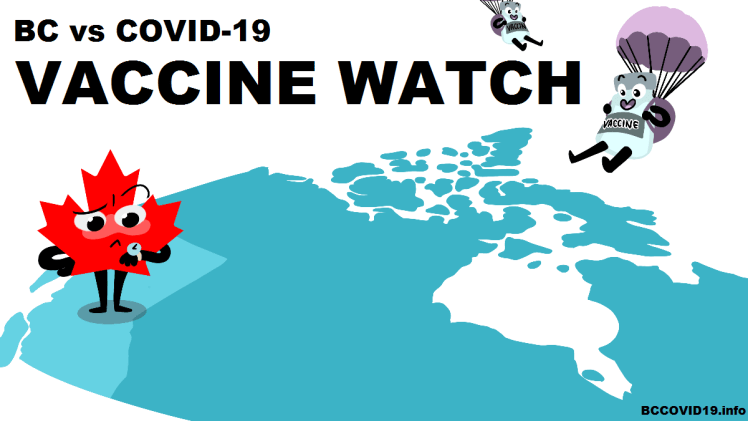
Dr. Bonnie Henry confirmed today that the first shipment of a COVID-19 vaccine (this one is from Pfizer) is expected to arrive in the next week. Tomorrow they will be running a logistic test to verify the handling plans and methods will successfully transport the vaccine intact to locations where it can be distributed from. The difficulty being that this specific vaccine must be stored at -80°C until shortly before it is ready to be injected.
The initial shipment is expected to only be enough to vaccinate a few thousand individuals, and current tentative plans are for it to go to health care providers first. We will learn more specific plans for the vaccine rollout in the coming days.
That’s all for now, stay safe everyone!
