
November Epidemiological Update
Today Dr. Bonnie Henry gave an epidemiological update on COVID-19 in BC. We will go over some of the slides here, but for the slideshow presentation please click here. For the video of Dr. Bonnie Henry going over the slideshow, please click here.
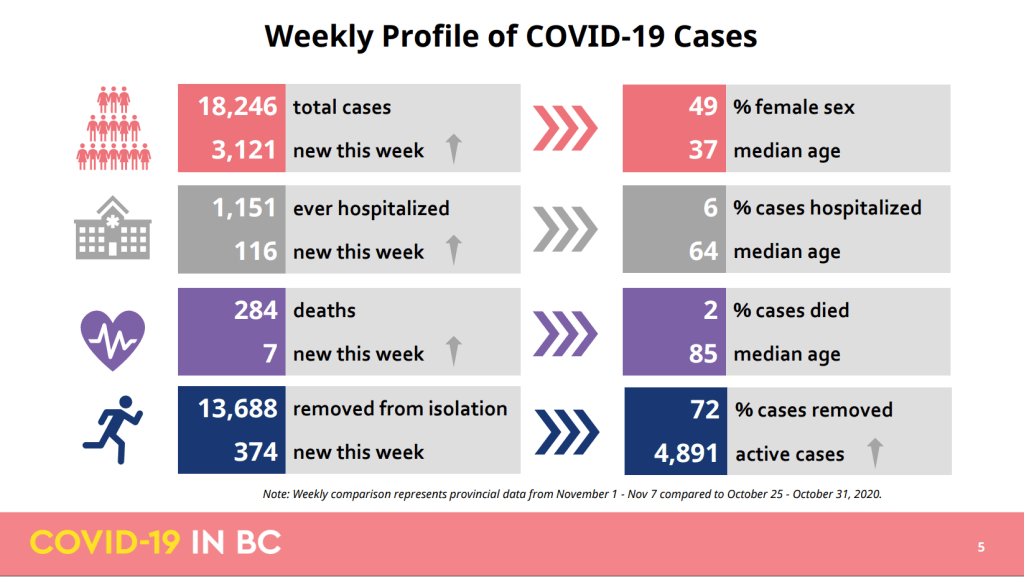
From the above slide, we can see that the median age of test-positive cases is now 37, down from 38 in last month’s report. Similarly, the median age of someone who is hospitalized due to COVID-19 is now 64, down from 67. And finally, the median age of those who die due to COVID-19 remains at 85, the same as in the previous report. The number of active cases has jumped to 4,891 from the previous 1,261.
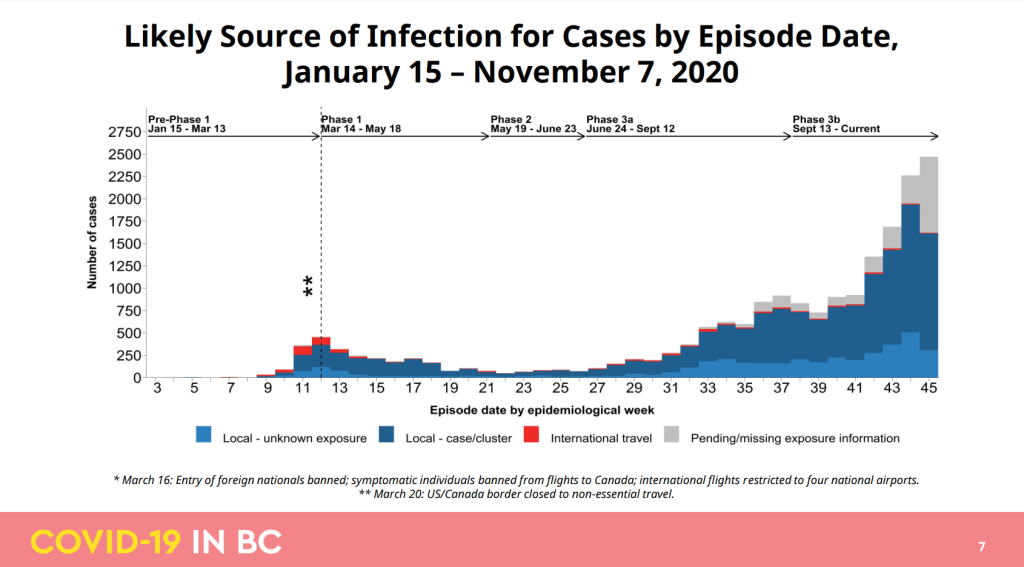
The above slide differs from the previous report’s comparable slide in that the timeline is now reported in epidemiological weeks, instead of specific days. One important thing to note is that much of the pending/missing information that was reported in last month’s slide has now been filled in. This is encouraging news and shows that contact tracing was largely successful during that period of time.
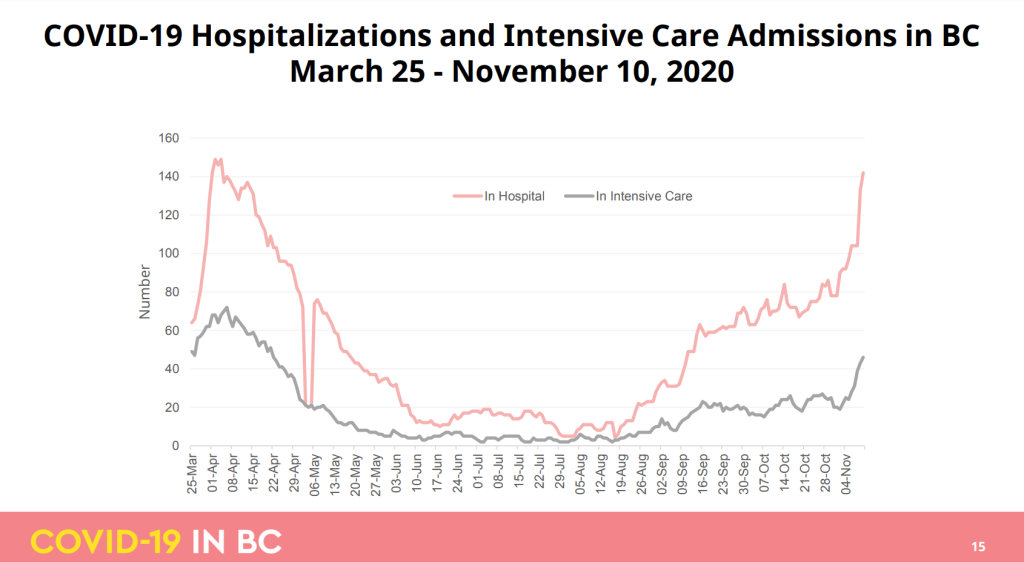
The slide above shows that our hospitalization rate is now starting to spike, along with the number of people being admitted into the ICU. Our numbers are quickly approaching those seen in the first wave BC experienced of COVID-19.
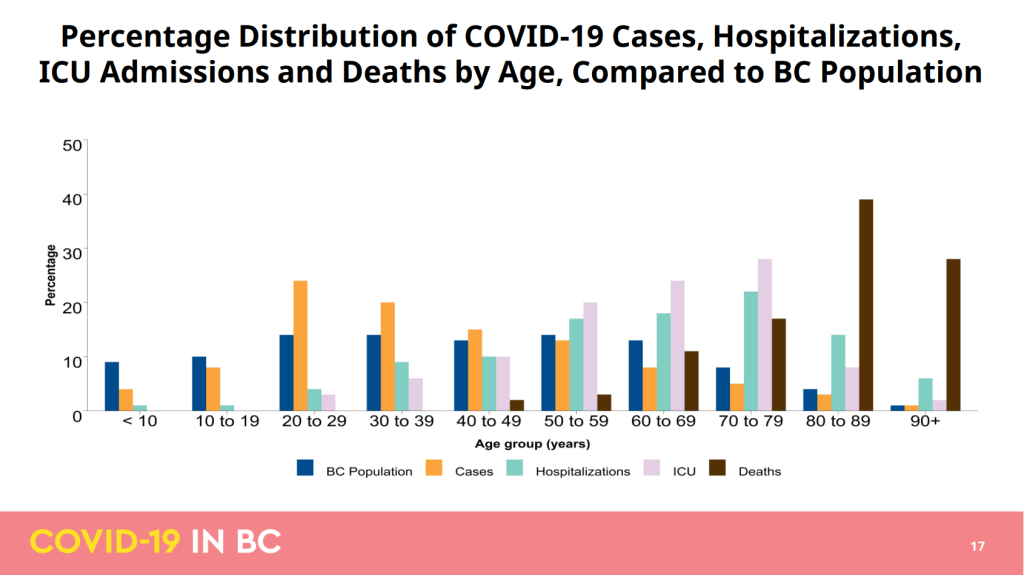
The above slide on the age distribution of population, COVID-19 cases, hospitalizations, ICU admittance, and deaths related to COVID-19 has stayed largely the same over the last month. An increase in the number of cases found in the 10-19 age bracket is the most noticeable change, and most of those cases are reported to be in the 18-19 age range.
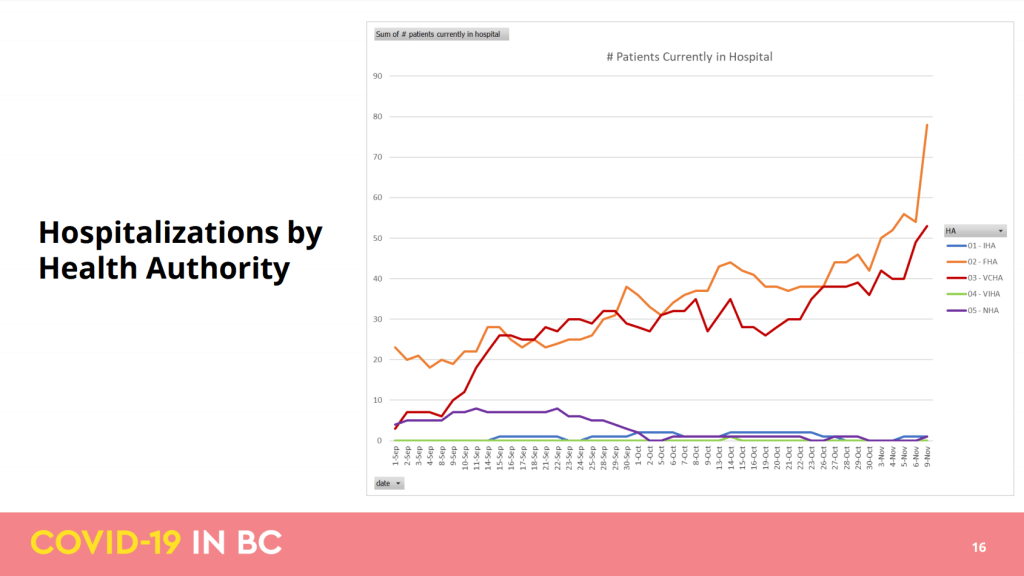
It will come as no surprise to anyone who has been following the pandemic in BC, to see that the majority of hospitalizations in the province are located within the Fraser and Vancouver Coastal Health Authorities, which also contain the most test-positive cases.
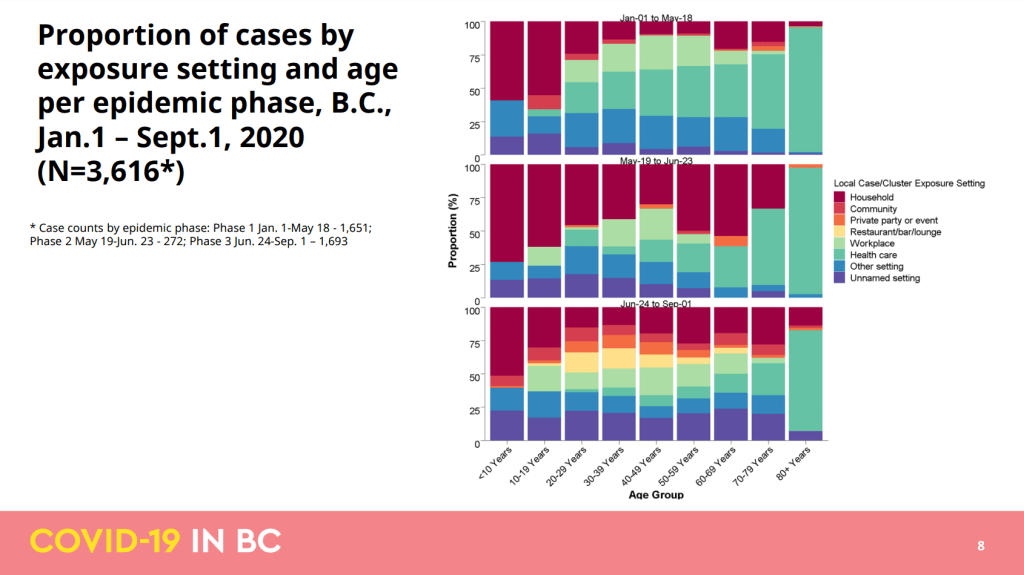
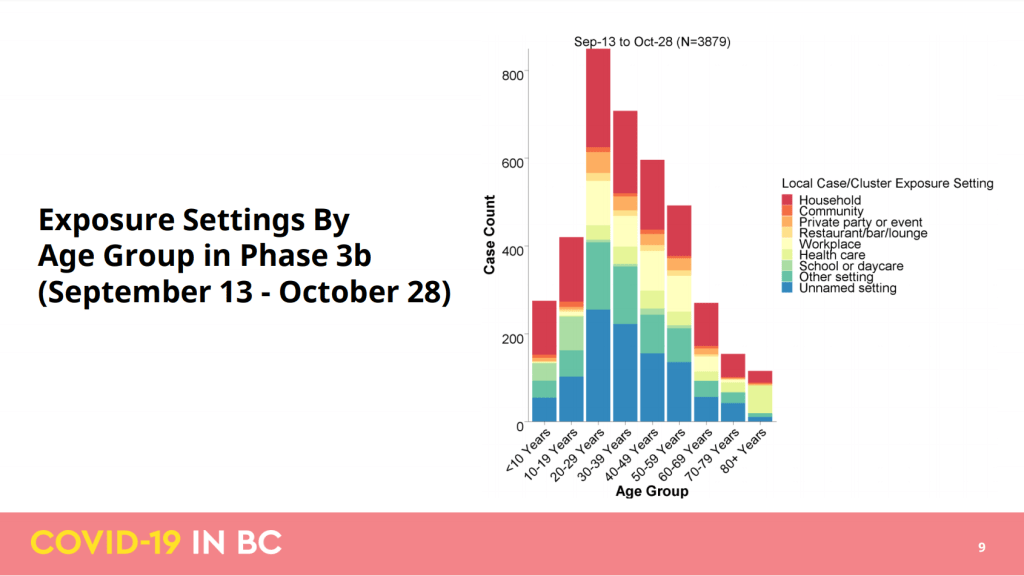
The above 2 slides are taken from different reports. The first slide is from the epidemiological report from September, and the second is from the report shared today. From the above charts, you can see that household exposures have grown significantly since the previous chart (June 24-Sept 1). School and Daycare exposures have only been added to the most recent chart, so there is no way to directly compare them to previous numbers.
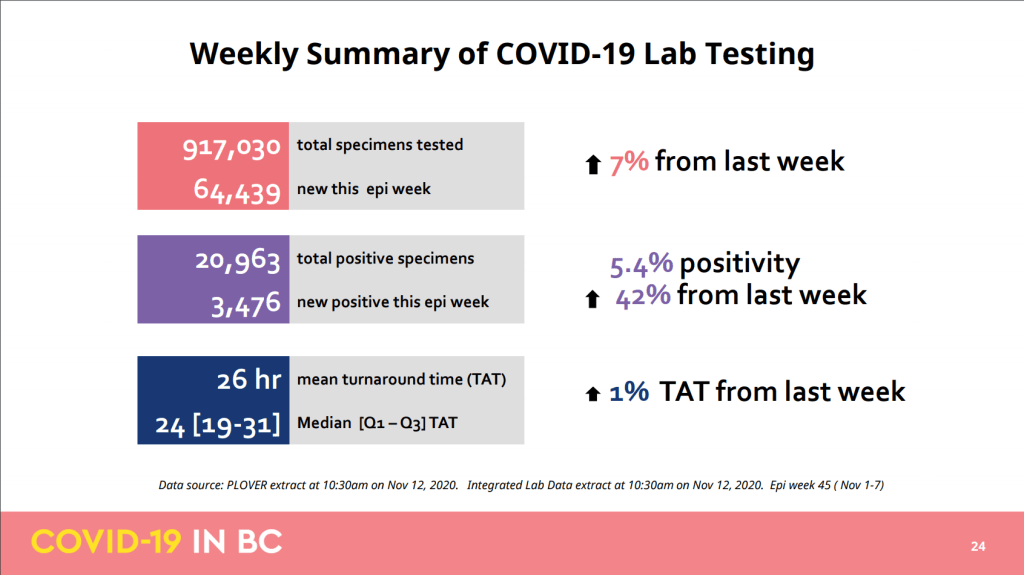
The above chart is specifically for Epi Week #45. The previous report’s comparable chart was for Epi Week #39. Our weekly test totals have gone up ~27.5% from week #39’s number of 50,450. Previously our test positive rate was just 1.6%, compared to the 5.4% test positive rate we are currently at. On the bright side, our test turnaround time has actually gone down, with the range previously running between 20 and 34 hours.
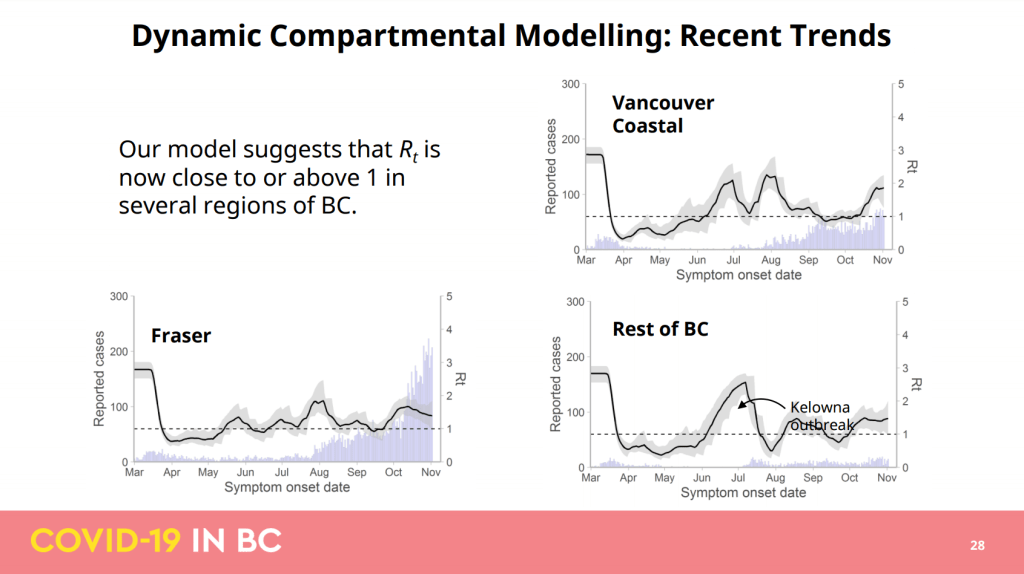
The above slide shows us infection rate modelling for different regions of the province. The model for the Fraser Health Authority is very interesting because it suggests a lower R0 than other regions, despite having by far the most COVID-19 cases in the province. This implies that despite there being a large volume of cases, the number of new infections caused by each patient is fewer than those caused by patients located in the Vancouver Coastal Health Authority (as an example).
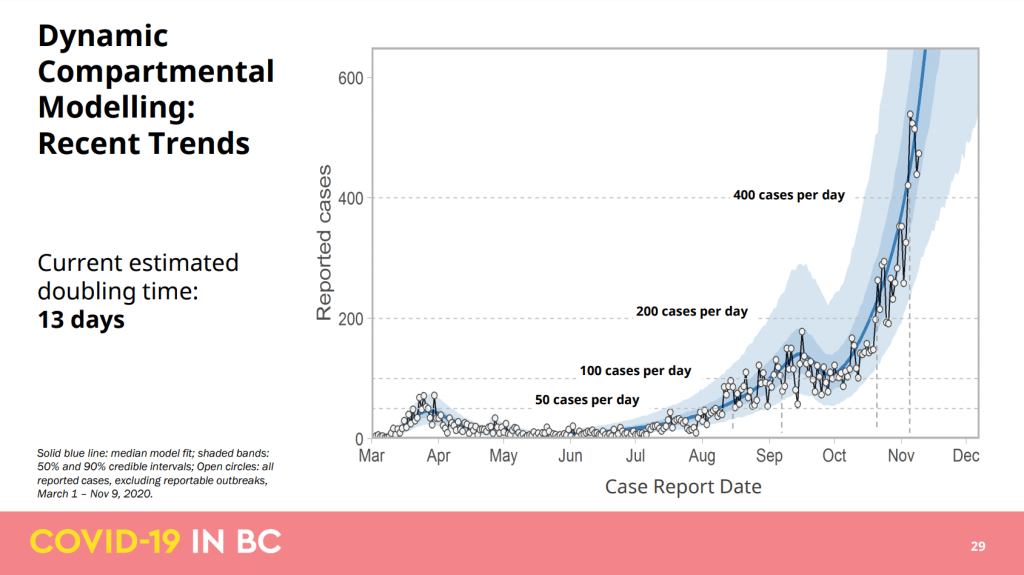
The above chart gives us the chilling information that our daily new case numbers are doubling every 13 days currently. This puts us on course to see numbers of over 1000 new cases in a single day in just a matter of weeks if we are not able to re-flatten the curve. But despite how scary this sounds, it also tells us that public health has not completely lost control of the viral spread. In September England saw their new case numbers doubling only every 7-8 days! Earlier in the pandemic’s first wave, some places saw their new infection numbers double in even fewer days. So while our situation is very serious and alarming, there is still every reason to believe we can get it back under control.
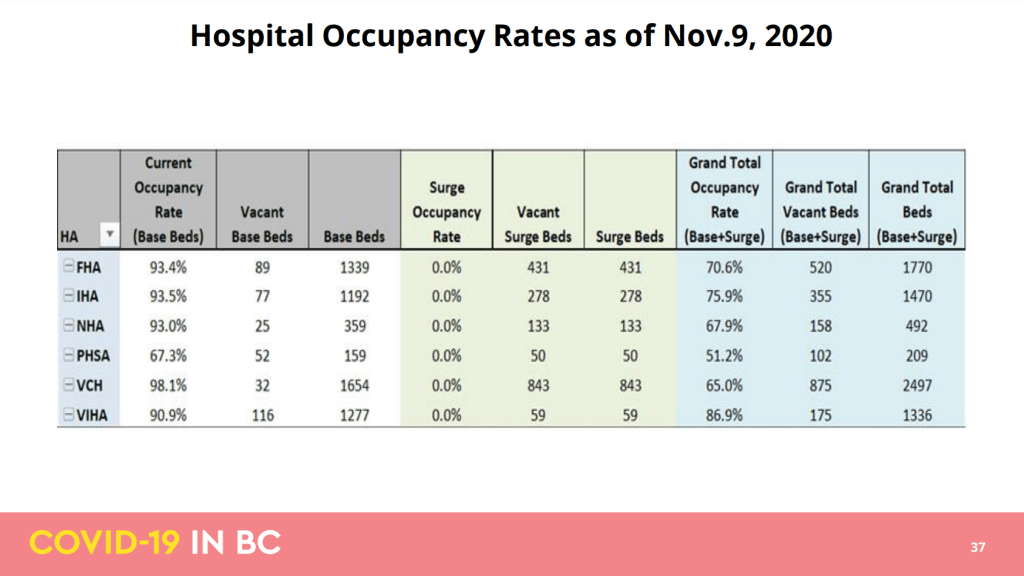
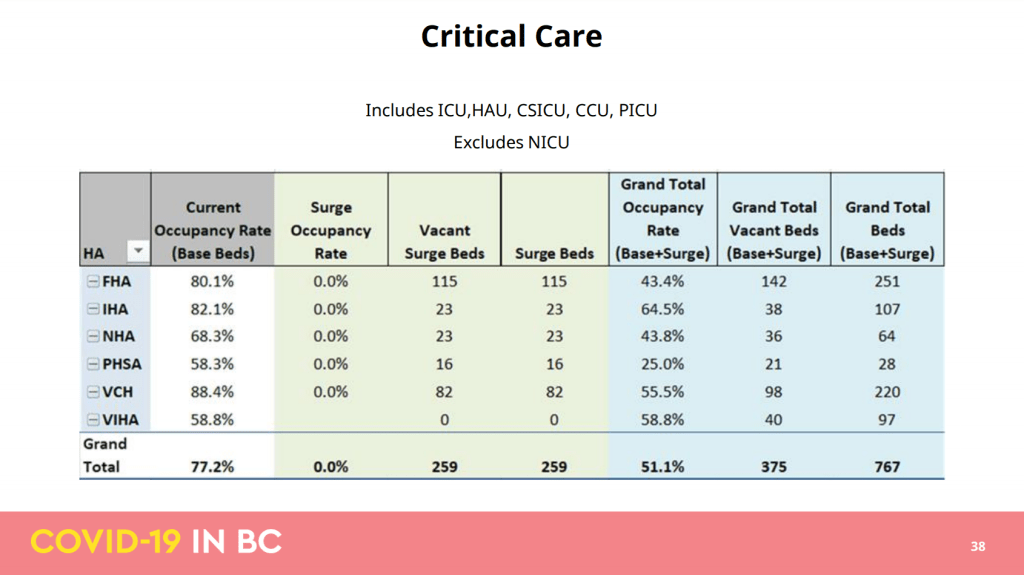
The above 2 slides show the current hospital capacity in BC, broken down by health authority and also by the bed type. It is important to note that most health authorities are coming close to filling their base bed capacity at this point. However, there remains significant surge bed capacity available should the need arise. Beyond that, Minister Adrian Dix also confirmed in the briefing this afternoon that emergency locations such as the Vancouver Convention Centre, which are marked for hospital use should the need arise, are not factored into this chart. So in a very worst-case scenario, our province remains prepared for much higher hospitalization numbers. And let us all hope that they are never needed.
That’s all for now, but we highly recommend you check out the complete report here, there is a lot more info, including details on schools, and the flu vaccine that you may find useful or informative. Stay safe everyone!
