
Successfully navigating the COVID-19 pandemic means learning how to manage your transmission risk levels. While few could argue that the safest option is to never leave your house, for most of us, this isn’t a realistic option. So whether it’s going to work or school, buying groceries or other supplies, or taking part in various social or recreational activities, all come with different levels of risk associated with them.
Over July, the US CDC ran a study on possible community exposure opportunities, to see if any commonalities were found between people who later tested positive for COVID-19, but were not shared by those who only tested negative. In total there were 314 participants, with the number split roughly in half for those who tested positive or negative for the virus. Both groups reported had more than 70% of participants claiming they were “always using cloth face coverings or other mask types when in public”, (71% for the group that tested positive for COVID-19, and 74% for those who tested negative). In terms of outings and activities, both groups had reported no significant differences in:
- shopping
- gatherings with ≤10 persons in a home
- gatherings with >10 persons in a home
- going to an office setting
- going to a salon
- going to a gym
- using public transportation
- going to a bar/coffee shop
- attending church or religious gatherings
The only activity that was not equally common in both groups was dining in at restaurants, where the test-positive group was more than twice as likely to have done so, according to the adjusted odds ratio. Unfortunately, the study did not differentiate between dining indoors or outdoors and suffered from other notable limitations as well (please see the 3rd paragraph in the Discussion section). As such, this study should be considered critically and carefully.

Tangentially related to the above, a risk analysis graphic has been making its way around the internet lately. It compares different scenarios and assigns a risk level based on ventilation, mask usage, time, and more. You may have already seen this chart on your social media feeds (pictured below).
As you can see, sitting in a restaurant and eating could fall into either the medium or high risk classifications, or at least according to this chart.
The above chart originally comes from a peer-reviewed analysis of the science behind the rules of physical distancing. It reveals the origins of the 2m rule for distancing, discusses the effects that force of emission, ventilation, and exposure time can have on droplet spread, and re-iterates the likelihood that COVID-19 can spread through aerosols. All of this is to argue the need for a more nuanced model than the existing 2m distancing guideline and offers the above chart as their alternative.
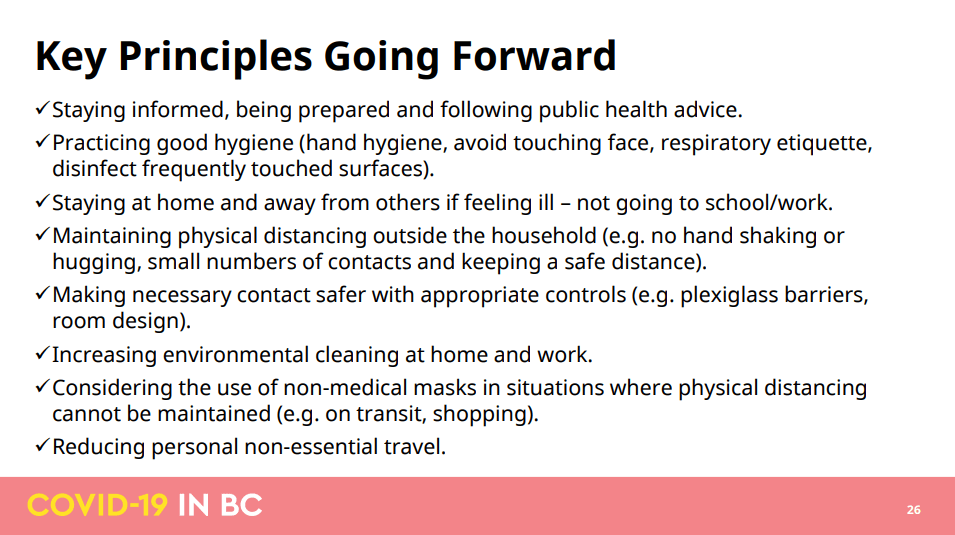
(Before I continue, I need to express that here in BC we have a series of guidelines that are meant to work in tandem (shown in the below graphic) and not just the single 2m distancing rule. We also have rules about hygiene and respiratory etiquette which will greatly minimize the dispersal of offending droplets. So using an unimpeded cough or sneeze to show that 2m distancing is insufficient isn’t as ruinous for our guidelines as it may immediately seem. Similarly, BC has supported the belief that COVID-19 could spread via aerosols under specific conditions even as far back as February, and while we have learned more in this regard since then, it is still not believed to be the main source of transmission.)
So while not all elements of this analysis directly relate to BC the same way that they would to the safety measures used in the USA, there are still many parts that do. Some of the key points of this analysis include the belief that viral particles are affected by airflow, and that distancing rules should reflect ventilation, occupancy and exposure time.
As for the chart detailing various risk levels based on different factors, the specific method for its creation is not shared, nor is any scientific data that may have been involved. It is as if some very well educated people read a large number of relevant studies on the related topics and then gave their best opinions based on abstract information. I can not speak for its accuracy, and I am not an expert. All I can tell you is that it makes sense to me and that you need to make your own judgement when determining acceptable levels of risk in your activities.
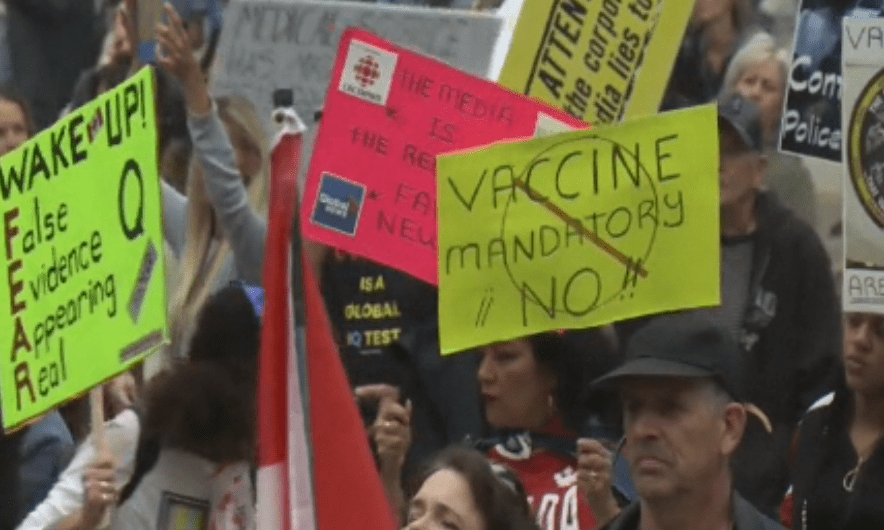
In other news, there was a rally at the Vancouver Art Gallery today, populated by people who are against mandatory masks, mandatory vaccines, being on lock-down (none of which currently exist in BC or Canada), and many scientific facts to do with COVID-19. About 700 people were in attendance, during some of the worst air quality conditions of any major city in the world. We will not know what effect this could have on our COVID-19 case numbers for about 10-14 days.
That’s all for now, stay safe everyone!
